State Tax Burden can Impact Net Income in Retirement - Pick the Right Place
 |
| 2024 Best States To Retire - Sal Lesley |
The States Tax Burden in 2024
When choosing a place to retire, pick some places you like for quality of life. Cost of living will vary among them, and a large part of the cost is the tax burden that each state and locality will take from you to live there in order to pay for its services. Uncle Sam takes his cut of our past year’s earnings every April, even if you become an expat, and since the tax code is so complicated, it’s hard for the average person to tell how they will be impacted. One simple ratio known as the “tax burden” helps cut through the confusion. Unlike tax rates, which vary widely based on an individual’s circumstances, tax burden measures the proportion of total personal income that residents pay toward state and local taxes. It isn’t uniform across the U.S., either.
Neighboring states can have radically different burdens, e.g. Vermont has the 2nd highest burden, while New Hampshire is 49th. California is 9th, while Nevada is 41st. Of course, the details of how you get your income, e.g., taxable distributions from an IRA/401k or pension, tax exempt bonds, social security, etc. will change how a particular state's tax system will bare on you. Cost of living may make tax burden moot, e.g. Hawaii (2nd) and Alaska (50th) have some of the highest cost of living.
To determine the residents with the biggest tax burdens, WalletHub
compared the 50 states based on the cost of three types of taxes —
property taxes, individual income taxes, and sales and excise taxes — as
a share of total personal income in the state.
Key Findings
- New York has the highest overall tax burden, while Alaska has the lowest.
- Maine has the highest property tax burden, while Alabama has the lowest.
- California has the highest individual income tax burden, while seven states (including Texas, Florida and Washington) have the lowest.
- Washington has the highest sales and excise tax burden, while New Hampshire has the lowest.
- Red states have a lower tax burden than blue states, on average.
For more fun (or not so fun) facts about 2024’s tax landscape, check out WalletHub’s Tax Day Facts infographic.
“It’s easy to be dismayed at tax time when you see just how much of your income you lose. Living in a state with a low tax burden can alleviate some of that stress. Some states charge no income tax or no sales tax, although all states have some form of property taxes and excise taxes.”
Cassandra Happe, WalletHub Analyst
Main Findings
| State | Rank |
|---|---|
| State | Rank |
| New York | 1 |
| Hawaii | 2 |
| Vermont | 3 |
| Maine | 4 |
| California | 5 |
| Connecticut | 6 |
| Minnesota | 7 |
| Illinois | 8 |
| New Jersey | 9 |
| Rhode Island | 10 |
| Utah | 11 |
| Kansas | 12 |
| Maryland | 13 |
| Iowa | 14 |
| Nebraska | 15 |
| Ohio | 16 |
| Indiana | 17 |
| Arkansas | 18 |
| Mississippi | 19 |
| Massachusetts | 20 |
| Virginia | 21 |
| West Virginia | 21 |
| Oregon | 23 |
| Colorado | 24 |
| Pennsylvania | 25 |
| Wisconsin | 26 |
| Louisiana | 27 |
| Kentucky | 28 |
| Washington | 29 |
| New Mexico | 30 |
| Michigan | 31 |
| North Carolina | 32 |
| Idaho | 33 |
| Arizona | 34 |
| Missouri | 35 |
| Georgia | 36 |
| Texas | 37 |
| Alabama | 38 |
| Montana | 39 |
| South Carolina | 39 |
| Nevada | 41 |
| Oklahoma | 42 |
| North Dakota | 43 |
| South Dakota | 44 |
| Delaware | 45 |
| Tennessee | 46 |
| Florida | 47 |
| Wyoming | 48 |
| New Hampshire | 49 |
| Alaska | 50 |
Overall Tax Burden by State
| Overall Rank* | State | Total Tax Burden (%) |
Property Tax Burden (%) |
Individual Income Tax Burden (%) |
Total Sales & Excise Tax Burden (%) |
|---|---|---|---|---|---|
| 1 | New York | 12.02% | 4.36% (5) | 4.63% (2) | 3.03% (31) |
| 2 | Hawaii | 11.80% | 2.64% (25) | 3.82% (6) | 5.34% (3) |
| 3 | Vermont | 11.12% | 4.85% (2) | 3.09% (11) | 3.18% (27) |
| 4 | Maine | 10.74% | 4.86% (1) | 2.59% (21) | 3.29% (24) |
| 5 | California | 10.40% | 2.73% (23) | 4.87% (1) | 2.80% (37) |
| 6 | Connecticut | 10.08% | 3.95% (6) | 3.42% (9) | 2.71% (40) |
| 7 | Minnesota | 9.95% | 2.82% (22) | 4.01% (4) | 3.12% (28) |
| 8 | Illinois | 9.67% | 3.67% (9) | 2.57% (22) | 3.43% (21) |
| 9 | New Jersey | 9.47% | 4.59% (3) | 2.36% (30) | 2.52% (44) |
| 10 | Rhode Island | 9.38% | 3.83% (7) | 2.49% (24) | 3.06% (30) |
| 11 | Utah | 9.35% | 2.19% (38) | 3.57% (7) | 3.59% (16) |
| 12 | Kansas | 9.29% | 3.04% (16) | 2.67% (17) | 3.58% (17) |
| 13 | Maryland | 9.26% | 2.60% (30) | 4.00% (5) | 2.66% (41) |
| 14 | Iowa | 9.21% | 3.39% (12) | 2.39% (29) | 3.43% (21) |
| 15 | Nebraska | 9.16% | 3.55% (10) | 2.60% (20) | 3.01% (32) |
| 16 | Ohio | 8.92% | 2.72% (24) | 2.48% (26) | 3.72% (13) |
| 17 | Indiana | 8.85% | 2.14% (39) | 3.06% (12) | 3.65% (14) |
| 18 | Arkansas | 8.79% | 1.65% (48) | 2.26% (32) | 4.88% (6) |
| 19 | Mississippi | 8.76% | 2.63% (26) | 1.86% (36) | 4.27% (8) |
| 20 | Massachusetts | 8.55% | 3.35% (13) | 3.37% (10) | 1.83% (45) |
| 21 | Virginia | 8.45% | 2.89% (21) | 2.98% (14) | 2.58% (43) |
| 21 | West Virginia | 8.45% | 2.22% (37) | 2.61% (19) | 3.62% (15) |
| 23 | Oregon | 8.44% | 2.95% (18) | 4.30% (3) | 1.19% (48) |
| 24 | Colorado | 8.42% | 2.93% (20) | 2.49% (24) | 3.00% (33) |
| 25 | Pennsylvania | 8.36% | 2.62% (28) | 2.64% (18) | 3.10% (29) |
| 26 | Wisconsin | 8.32% | 2.98% (17) | 2.57% (22) | 2.77% (39) |
| 27 | Louisiana | 8.29% | 1.83% (46) | 1.57% (39) | 4.89% (5) |
| 28 | Kentucky | 8.26% | 1.89% (43) | 2.98% (14) | 3.39% (23) |
| 29 | Washington | 8.04% | 2.58% (31) | 0.00% (44) | 5.46% (1) |
| 30 | New Mexico | 8.03% | 1.86% (44) | 1.13% (40) | 5.04% (4) |
| 31 | Michigan | 8.02% | 2.94% (19) | 2.23% (33) | 2.85% (36) |
| 32 | North Carolina | 7.89% | 2.00% (42) | 2.68% (16) | 3.21% (26) |
| 33 | Idaho | 7.86% | 2.12% (40) | 2.47% (27) | 3.27% (25) |
| 34 | Arizona | 7.79% | 2.26% (36) | 1.62% (38) | 3.91% (10) |
| 35 | Missouri | 7.76% | 2.41% (35) | 2.40% (28) | 2.95% (34) |
| 36 | Georgia | 7.65% | 2.50% (33) | 2.36% (30) | 2.79% (38) |
| 37 | Texas | 7.56% | 3.71% (8) | 0.00% (44) | 3.85% (12) |
| 38 | Alabama | 7.52% | 1.33% (50) | 2.01% (34) | 4.18% (9) |
| 39 | Montana | 7.50% | 3.24% (14) | 3.00% (13) | 1.26% (47) |
| 39 | South Carolina | 7.50% | 2.63% (26) | 2.00% (35) | 2.87% (35) |
| 41 | Nevada | 7.37% | 2.02% (41) | 0.00% (44) | 5.35% (2) |
| 42 | Oklahoma | 7.04% | 1.71% (47) | 1.75% (37) | 3.58% (17) |
| 43 | North Dakota | 6.80% | 2.44% (34) | 0.90% (41) | 3.46% (19) |
| 44 | South Dakota | 6.44% | 2.58% (31) | 0.00% (44) | 3.86% (11) |
| 45 | Delaware | 6.43% | 1.85% (45) | 3.57% (7) | 1.01% (49) |
| 46 | Tennessee | 6.07% | 1.64% (49) | 0.05% (43) | 4.38% (7) |
| 47 | Florida | 6.05% | 2.61% (29) | 0.00% (44) | 3.44% (20) |
| 48 | Wyoming | 5.70% | 3.10% (15) | 0.00% (44) | 2.60% (42) |
| 49 | New Hampshire | 5.63% | 4.51% (4) | 0.15% (42) | 0.97% (50) |
| 50 | Alaska | 4.93% | 3.54% (11) | 0.00% (44) | 1.39% (46) |
Note: *No. 1 = Highest

Property Tax as % of Personal Income
Highest
- 1. Maine
- 2. Vermont
- 3. New Jersey
- 4. New Hampshire
- 5. New York
Lowest
- 46. Louisiana
- 47. Oklahoma
- 48. Arkansas
- 49. Tennessee
- 50. Alabama

Individual Income Tax as % of Personal Income
Highest
- 1. California
- 2. New York
- 3. Oregon
- 4. Minnesota
- 5. Maryland
Lowest
- T-44. Alaska
- T-44. Florida
- T-44. Nevada
- T-44. South Dakota
- T-44. Texas

Total Sales & Excise Tax as % of Personal Income
Highest
- 1. Washington
- 2. Nevada
- 3. Hawaii
- 4. New Mexico
- 5. Louisiana
Lowest
- 46. Alaska
- 47. Montana
- 48. Oregon
- 49. Delaware
- 50. New Hampshire
Show More
In-Depth Look at State Tax Burdens
Total Tax Burden
New York has the highest total tax burden, with residents paying out around 12% of their income to state and local governments. That includes 4.6% on income taxes, 4.4% on property taxes, and 3% in sales and excise taxes.
Alaska has the lowest total tax burden, as its residents pay no income tax. They also pay out only 3.5% of their income in property taxes and 1.4% in sales and excise taxes, for a total of 4.9%.
Income Tax Burden
California has the costliest state and local income taxes in the nation, at 4.9% of its residents’ income. On the other end of the spectrum, Alaska, Florida, Nevada, South Dakota, Texas, Washington, and Wyoming do not charge any income tax. This makes them attractive states to move to.
Property Tax Burden
Maine charges the most in property taxes, at nearly 4.9% of residents’ income. All states have some sort of property tax, but Alabama’s is by far the lowest, at just 1.3%.
Sales and Excise Tax Burden
Residents of Washington pay out around 5.5% of their income in sales and excise taxes every year. New Hampshire residents have the lowest burden – the state does not charge a general sales tax, and other excise taxes only work out to less than 1% of the average resident’s income each year.
Blue States vs. Red States
Ask the Experts
For more insight on the differences in state tax policies, we asked a panel of taxation experts to weigh in with their thoughts on the following key questions:
- What state and local tax instruments are most fair? Least fair?
- What’s the relationship between state tax burden and economic growth?
- Should states and localities tax property at different marginal rates like they do income?
- What makes some state and local tax systems better able to weather economic downturns?
- How has inflation affected local governments' tax revenues?
Ask the Experts
Blaine G. Saito
Assistant Professor of Law, Moritz College of Law – Ohio State University
Read More
John Kincaid
Robert
B. & Helen S. Meyner Professor of Government and Public Service and
Director of the Meyner Center for the Study of State and Local
Government – Lafayette College
Read More
Craig S. Maher
Distinguished
Professor; Director, School of Public Administration and Co-Editor
Public Finance Journal, Understanding Municipal Fiscal Health –
University of Nebraska at Omaha
Read More
Michael Belsky
Public Finance Policy Expert and Former Mayor of Highland Park, IL and Head of Fitch Rating’s Public Finance Group
Read More
Valerie Sasaki
Adjunct Faculty, Masters in Taxation Program, Portland State University; Chair, Taxation Practice, Samuels Yoelin Kantor LLP
Read More
Marcia Godwin
Ph.D. – Professor of Public Administration; Director of Part-Time Faculty Affairs – University of La Verne
Read More
More Experts
Methodology
In order to determine the states that tax their residents the most and least aggressively, WalletHub compared the 50 states across the following three tax burdens and added the results to obtain the overall tax burden for each state:
- Property Tax as a Share of Personal Income
- Individual Income Tax as a Share of Personal Income
- Total Sales & Excise Tax as a Share of Personal Income
Sources: Data used to create this ranking were collected as of March 12, 2024 from the Tax Policy Center.
Supporting Video Files:
Was this article helpful?
Important Disclosures
Ad Disclosure: Certain offers that appear on this site originate from paying advertisers. For full transparency, here is a list of our current advertisers.
Advertising impacts how and where offers appear on this site (including, for example, the order in which they appear and their prevalence). At WalletHub we try to present a wide array of offers, but our offers do not represent all financial services companies or products.
Advertising enables WalletHub to provide you proprietary tools, services, and content at no charge. Advertising does not impact WalletHub's editorial content including our best picks, reviews, ratings and opinions. Those are completely independent and not provided, commissioned, or endorsed by any company, as our editors follow a strict editorial policy.
WalletHub is not a financial advisor. Our goal is to provide you with top-notch content, data, and tools. You are responsible for deciding what financial products and providers are best for your needs.
Irrespective of whether an institution or professional is a paid advertiser, the presence of information on WalletHub does not constitute a referral or endorsement of the institution or professional by us or vice versa.
We work hard to show you up-to-date product terms, however, this information does not originate from us and thus, we do not guarantee its accuracy. Actual terms may vary. Before submitting an application, always verify all terms and conditions with the offering institution. Please let us know if you notice any differences.
Income Tax
Real Estate Tax
Sales Tax
41 States That Don't Tax Social Security Benefits | The Motley Fool
For some people, it's worth it to consider moving.
What's your biggest worry regarding retirement? For most people, it's simply outliving their money. That's why so many of us are working so hard to save as much as we possibly can right now.
The good news is, your retirement income might actually go a little bit further than you expect. Although Social Security was never intended to be an individual's sole source of retirement funding, at least this part of your future cash flow isn't taxed in most states.
Still, there are a few things you'll need to know about that taxation of your retirement benefits.
State taxation of Social Security retirement benefits
As of the latest look, 41 states don't tax Social Security retirement benefits. In alphabetical order, these states are:
- Alabama
- Alaska
- Arizona
- Arkansas
- California
- Delaware
- Florida
- Georgia
- Hawaii
- Idaho
- Illinois
- Indiana
- Iowa
- Kansas*
- Kentucky
- Louisiana
- Maine
- Maryland
- Massachusetts
- Michigan
- Mississippi
- Missouri
- Nebraska
- Nevada
- New Hampshire
- New Jersey
- New York
- North Carolina
- North Dakota
- Ohio
- Oklahoma
- Oregon
- Pennsylvania
- South Carolina
- South Dakota
- Tennessee
- Texas
- Virginia
- Washington
- Wisconsin
- Wyoming
* Kansas altered its tax laws just last month to make Social Security benefits tax-free beginning this tax year.
But what if you live (or plan on living) in one of the other nine states? Don't sweat it. Most of them are still relatively gentle when it comes to taxing these benefits.
Take Colorado as an example. Its residents between the ages of 55 and 64 aren't taxed on their first $20,000 worth of yearly Social Security income, while anyone over the age of 65 living in the Centennial State doesn't owe any income tax on their Social Security benefits. This means a huge swatch of older Coloradans are actually side-stepping the state's 4.4% flat income tax on at least a portion of their retirement income.
Meanwhile, Connecticut, Minnesota, Montana, New Mexico, Rhode Island, Utah, and Vermont each offer some degree of income-based tax breaks on Social Security income. That is to say, in several of these seven locales, only the highest of retirement earners will owe state taxes on any such benefits. In other states a decent-sized chunk of Social Security income is deductible from the federally reported taxable income generally used to determine state-based tax liabilities.
Last year was also the final year West Virginians' Social Security income will be fully taxed by the state. Earlier this year the state's legislature passed measures that will gradually phase out the taxability of these benefits. Only 65% of this income will taxable this year, and only 35% next year. Come 2026, the state won't be taxing any portion of anyone's Social Security income.
And the District of Columbia? Social Security retirement income is tax-exempt there as well.
By the way: Feeling compelled/pressured to join the crowd, many of the few states that do still tax even a portion of Social Security retirement income are now regularly considering a repeal of these tax laws.
That said, regardless of which state you live in, your Social Security benefits are at least still subject to federal income taxation. Not all of it, though.
Individuals with adjusted gross annual income between $25,000 and $34,000 will potentially owe income tax on up to half of their benefits. For anyone with retirement earnings in excess of $34,000, up to 85% of their Social Security benefits are considered taxable income. And for joint filers, these thresholds are raised to $32,000 and $44,000.
Still, even if you can save just a few thousand bucks in taxes every year just by living in a different state, it may well be worth the move.
A big enough benefit to consider when making plans
Of course, there's more to life than minimizing your annual tax bill. Maybe you've got close family in a state that still taxes Social Security benefits. Perhaps the cost of living is low even in a state that still taxes a sizable portion of your retirement income. There's always more to the story.
For many current and soon-to-be retirees, however, saving just a few thousand bucks per year could make a major difference with their budgets -- particularly for relatively high-earning retirees with income subject to state-level taxation. At the very least, it's something worth considering. That's especially true if you can sell your current home at an attractive price and/or find a new one at a price you also like.
The $22,924 Social Security bonus most retirees completely overlook
If you're like most Americans, you're a few years (or more) behind on your retirement savings. But a handful of little-known "Social Security secrets" could help ensure a boost in your retirement income. For example: one easy trick could pay you as much as $22,924 more... each year! Once you learn how to maximize your Social Security benefits, we think you could retire confidently with the peace of mind we're all after. Simply click here to discover how to learn more about these strategies.
Key Findings
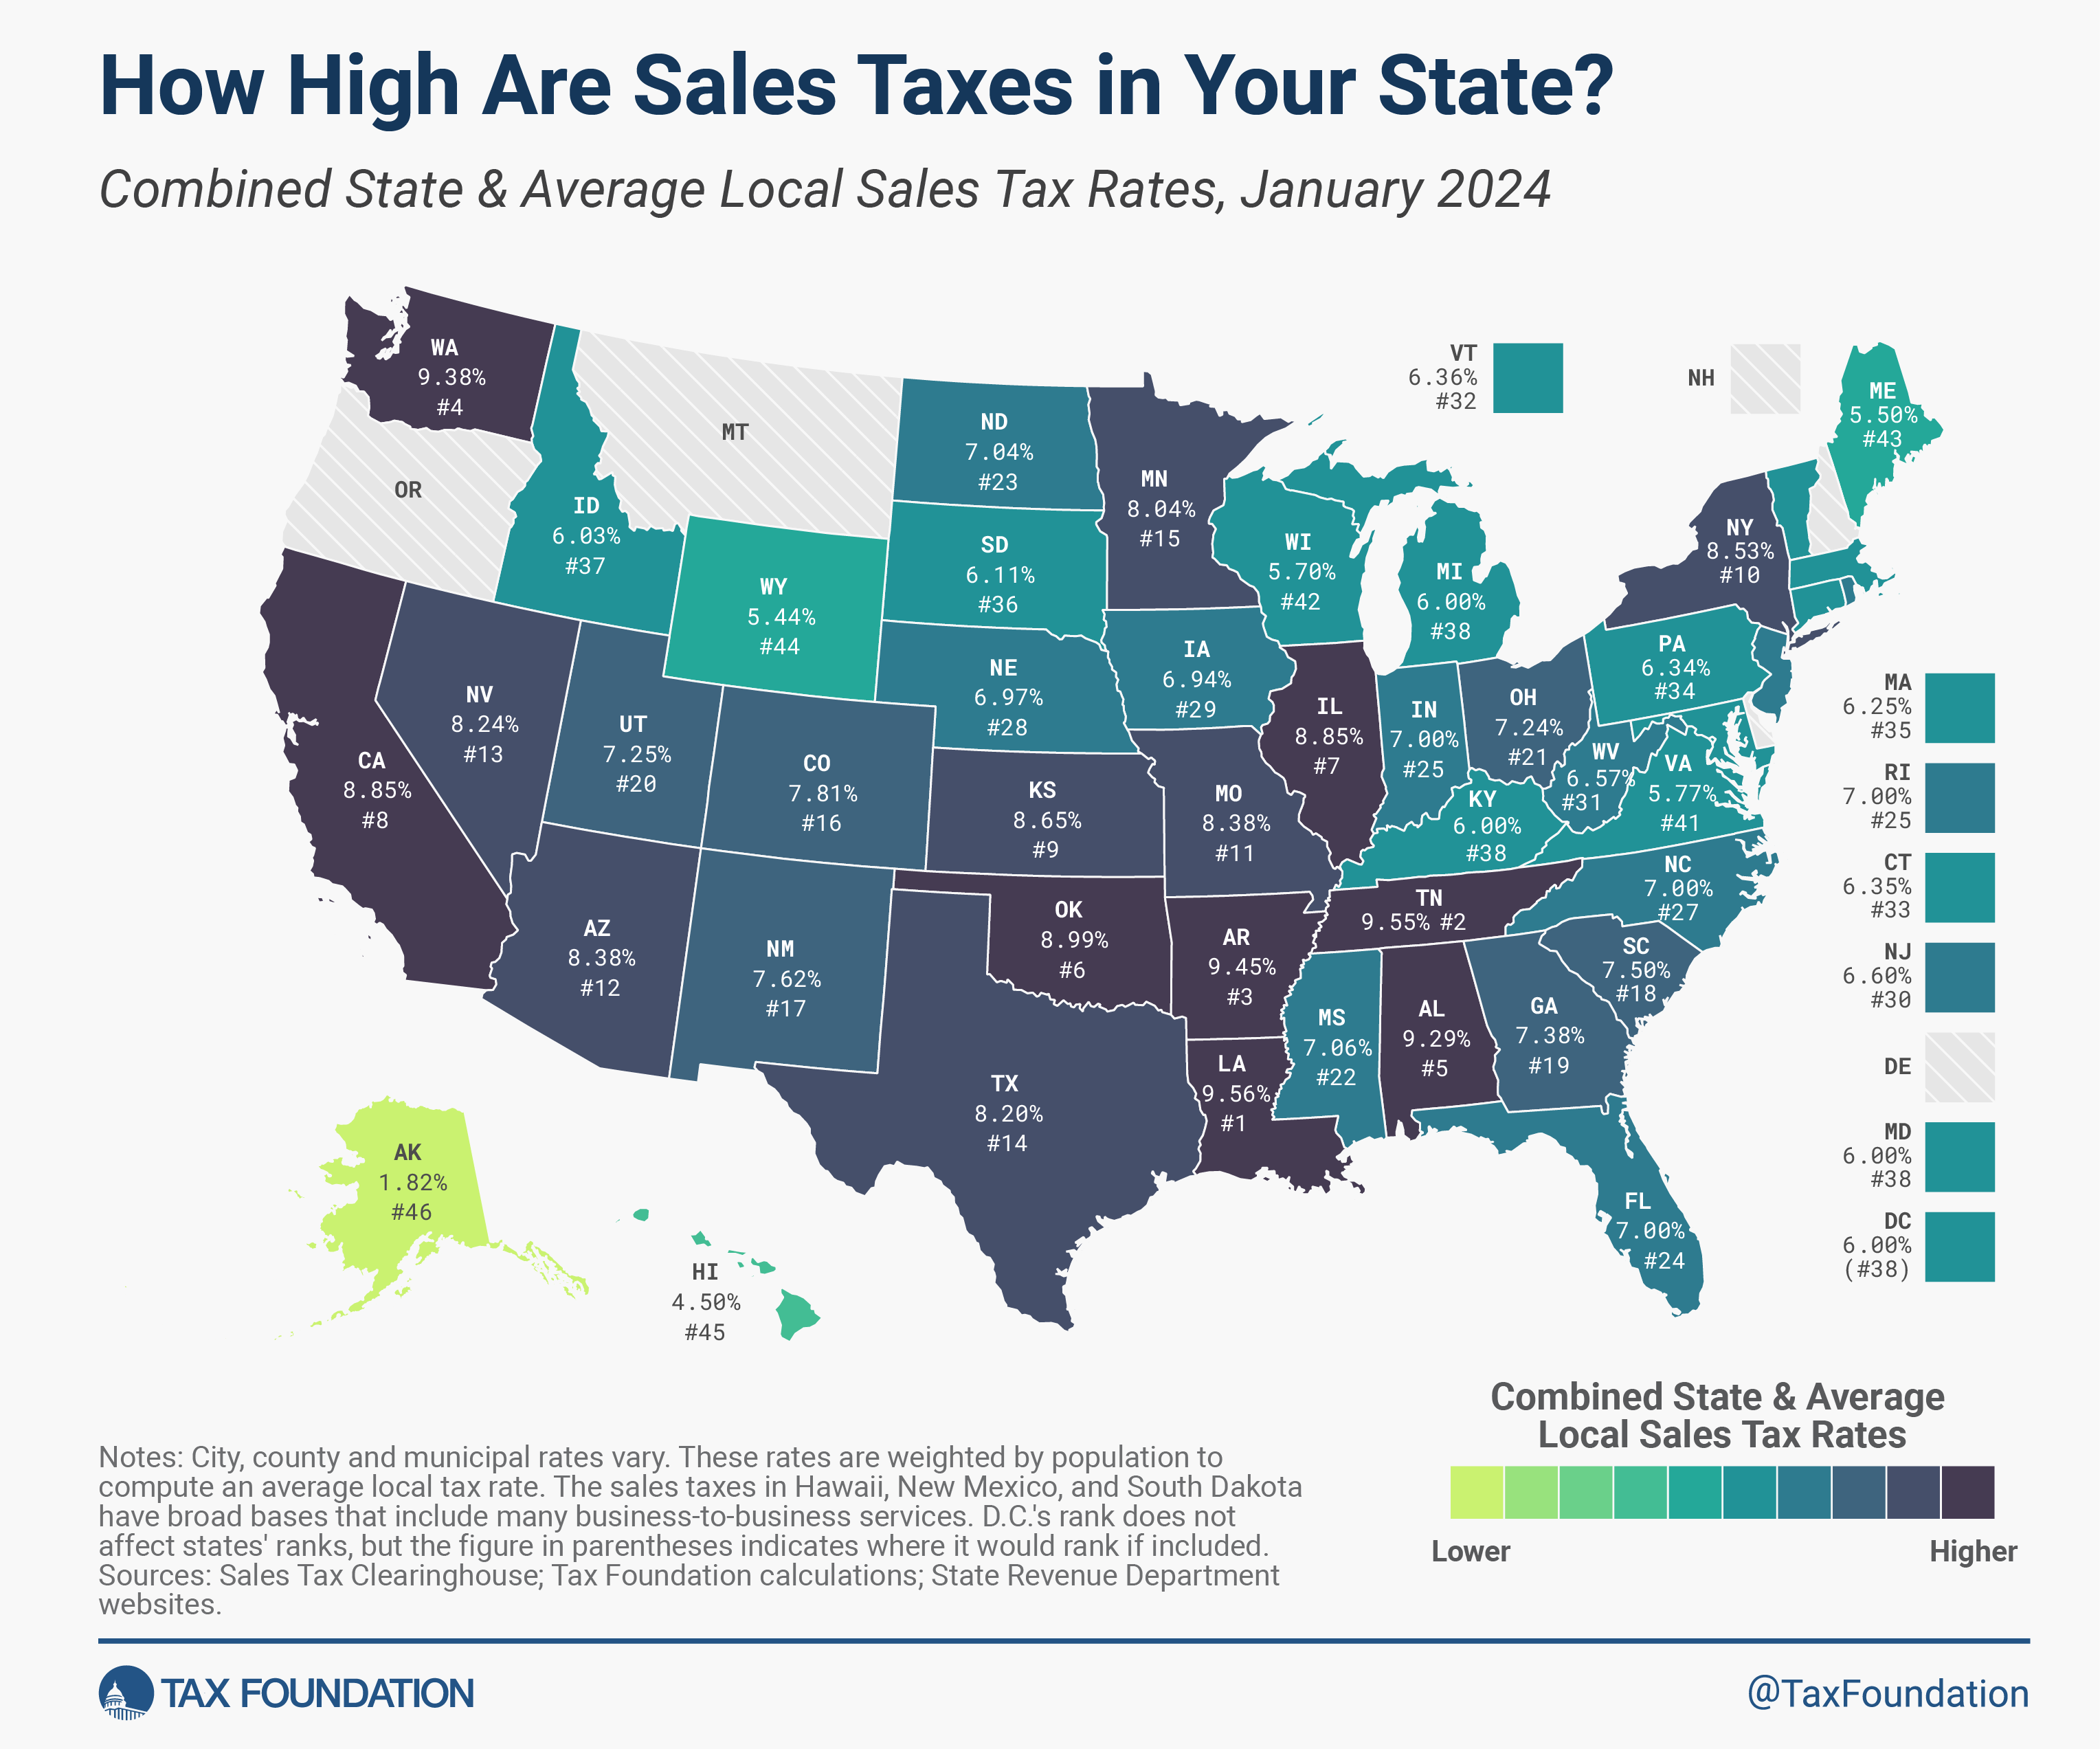
- Forty-five states and the District of Columbia collect statewide sales taxes.
- Local sales taxes are collected in 38 states. In some cases, they can rival or even exceed state rates.
- The five states with the highest average combined state and local sales taxA sales tax is levied on retail sales of goods and services and, ideally, should apply to all final consumption with few exemptions. Many governments exempt goods like groceries; base broadening, such as including groceries, could keep rates lower. A sales tax should exempt business-to-business transactions which, when taxed, cause tax pyramiding. rates are Louisiana (9.56 percent), Tennessee (9.55 percent), Arkansas (9.45 percent), Washington (9.38 percent), and Alabama (9.29 percent).
- Local sales taxA tax is a mandatory payment or charge collected by local, state, and national governments from individuals or businesses to cover the costs of general government services, goods, and activities. increases in the Twin Cities metro region of Minnesota, as well as in Milwaukee, Wisconsin, are responsible for the greatest movement in states’ average sales tax rates in the past six months.
- Sales tax rates differ by state, but sales tax bases also impact how much revenue is collected from a tax and how the tax affects the economy.
- Sales tax rate differentials can induce consumers to shop across borders or buy products online.
Introduction
Retail sales taxes are an essential part of most states’ revenue toolkits, responsible for 32 percent of state tax collections and 13 percent of local tax collections (24 percent of combined collections). They also benefit from being more pro-growth than the other major state tax, the individual income taxAn individual income tax (or personal income tax) is levied on the wages, salaries, investments, or other forms of income an individual or household earns. The U.S. imposes a progressive income tax where rates increase with income. The Federal Income Tax was established in 1913 with the ratification of the 16th Amendment. Though barely 100 years old, individual income taxes are the largest source of tax revenue in the U.S. , because they introduce fewer economic distortions.
Forty-five states impose state-level sales taxes, while consumers also face local sales taxes in 38 states, including Alaska, which does not impose a statewide tax. These local rates can be substantial, and some states with moderate statewide sales tax rates actually impose quite high combined state and local rates compared to other states. This report provides a population-weighted average of local sales taxes as of January 1, 2024, to give a sense of the average local rate for each state. Table 1 provides a full state-by-state listing of state and local sales tax rates.
Combined State and Local Sales Tax Rates
Five states forego statewide sales taxes: Alaska, Delaware, Montana, New Hampshire, and Oregon. Of these, only Alaska allows localities to impose local sales taxes.[1]
The five states with the highest average combined state and local sales tax rates are Louisiana (9.56 percent), Tennessee (9.55 percent), Arkansas (9.45 percent), Washington (9.38 percent), and Alabama (9.29 percent). The five states with the lowest average combined rates are Alaska (1.82 percent), Hawaii (4.50 percent), Wyoming (5.44 percent), Maine (5.50 percent), and Wisconsin (5.70 percent).
State Sales Tax Rates
California has the highest state-level sales tax rate, at 7.25 percent.[2] Four states tie for the second-highest statewide rate, at 7 percent: Indiana, Mississippi, Rhode Island, and Tennessee. The lowest non-zero state-level sales tax is in Colorado, which has a rate of 2.9 percent. Five states follow with 4 percent rates: Alabama, Georgia, Hawaii, New York, and Wyoming.[3]
No state rates have changed since South Dakota cut its state sales tax rate in 2023, a reduction set to expire after 2026. The Mount Rushmore State follows on the heels of New Mexico, which lowered the rate of its state-level sales tax—a hybrid tax the state refers to as its gross receipts taxA gross receipts tax, also known as a turnover tax, is applied to a company’s gross sales, without deductions for a firm’s business expenses, like costs of goods sold and compensation. Unlike a sales tax, a gross receipts tax is assessed on businesses and apply to business-to-business transactions in addition to final consumer purchases, leading to tax pyramiding. —from 5.125 percent to 5 percent in July 2022. Notably, if the revenue from the gross receipts tax in any single fiscal year from 2026 to 2029 is less than 95 percent of the previous year’s revenue, then the state’s rate will return to 5.125 percent on the following July 1.
Before that, the most recent statewide rate reduction was Louisiana’s cut, from 5.0 to 4.45 percent, in July 2018. State lawmakers have instead prioritized income tax cuts, which yield more economic benefit, reducing individual or corporate income taxA corporate income tax (CIT) is levied by federal and state governments on business profits. Many companies are not subject to the CIT because they are taxed as pass-through businesses, with income reportable under the individual income tax. rates (or both) in more than two dozen states in the past two years alone.
Local Sales Tax Rates
The five states with the highest average local sales tax rates are Alabama (5.29 percent), Louisiana (5.11 percent), Colorado (4.91 percent), New York (4.53 percent), and Oklahoma (4.49 percent).
Only Minnesota and Wisconsin saw a ranking change of more than one place since July, both declining two places due to local tax increases in major population centers. Arizona, California, Colorado, Maine, New Mexico, Ohio, Tennessee, and Wyoming all improved by one place, typically due to rate increases in peer states, while, in addition to movement in Minnesota and Wisconsin, the states of Illinois, Louisiana, Missouri, and Utah all slid one place, due to tax increases in a variety of smaller jurisdictions.
In Minnesota, the seven-county Twin Cities metro area saw a 1 percentage point sales tax increase, split between 0.75 percent for transportation and 0.25 percent for housing, which went into effect October 1, 2023. In neighboring Wisconsin, the city of Milwaukee imposed a new 2 percent sales tax on January 1, 2024, while Milwaukee County increased its sales tax rate from 0.5 to 0.9 percent. In Hawaii, a 0.5 percent surcharge was approved for Maui. Many other states saw a smattering of local sales tax rate changes—mostly increases—as well.
Some cities in New Jersey
are in “Urban Enterprise Zones,” where qualifying sellers may collect
and remit at half the 6.625 percent statewide sales tax rate (3.3125
percent), a policy designed to help local retailers compete with
neighboring Delaware, which forgoes a sales tax. We represent this
anomaly as a negative 0.03 percent statewide average local rate
(adjusting for population as described in the methodology section
below), and the combined rate reflects this subtraction. Despite the
slightly favorable impact on the overall rate, this lower rate
represents an implicit acknowledgment by New Jersey officials that their
6.625 percent statewide rate is uncompetitive with neighboring
Delaware’s lack of a sales tax.
The Role of Competition in Setting Sales Tax Rates
Avoidance of sales tax is most likely to occur in areas where there is a significant difference between jurisdictions’ rates. Research indicates that consumers can and do leave high-tax areas to make major purchases in low-tax areas, such as from cities to suburbs. For example, evidence suggests that Chicago-area consumers make major purchases in surrounding suburbs or online to avoid Chicago’s 10.25 percent sales tax rate.
At the statewide level, businesses sometimes locate just outside the borders of high sales-tax areas to avoid being subjected to their rates. A stark example of this occurs in New England, where even though I-91 runs up the Vermont side of the Connecticut River, many more retail establishments choose to locate on the New Hampshire side to avoid sales taxes. One study shows that per capita sales in border counties in sales tax-free New Hampshire have tripled since the late 1950s, while per capita sales in border counties in Vermont have remained stagnant. At one time, Delaware actually used its highway welcome sign to remind motorists that Delaware is the “Home of Tax-Free Shopping.”
State and local governments should be cautious about raising rates too high relative to their neighbors because doing so will yield less revenue than expected or, in extreme cases, revenue losses despite the higher tax rate.
Sales Tax Bases: The Other Half of the Equation
This report ranks states based on tax rates and does not account for differences in tax bases (e.g., the structure of sales taxes, defining what is taxable and nontaxable). States can vary greatly in this regard. For instance, most states exempt groceries from the sales tax, others tax groceries at a limited rate, and still others tax groceries at the same rate as all other products. Some states exempt clothing or tax it at a reduced rate.
Tax experts generally recommend that sales taxes apply to all final retail sales of goods and services but not intermediate business-to-business transactions in the production chain. These recommendations would result in a tax system that is not only broad-based but also “right-sized,” applying once and only once to each product the market produces. Despite agreement in theory, the application of most state sales taxes is far from this ideal.
Hawaii has the broadest sales tax in the United States, but it taxes many products multiple times and, by one estimate, ultimately taxes 119 percent of the state’s personal income. This base is far wider than the national median, where the sales tax applies to 36 percent of personal income.
Methodology
Sales Tax Clearinghouse publishes quarterly sales tax data at the state, county, and city levels by ZIP code. We weight these numbers according to the most recent Census population figures to give a sense of the prevalence of sales tax rates in a particular state. This is a change from previous editions, where we used figures available every decade. While changes due to the new weighting were mostly trivial, we show changes in rank based on January 1 figures recalculated under the new population weighting. Due to the updated population weighting, this report is not strictly comparable to previously published editions, though differences amount to minor rounding errors.
It should also be noted that while the Census Bureau reports population data using a five-digit identifier that looks much like a ZIP code, this is actually a ZIP Code Tabulation Area (ZCTA), which attempts to create a geographical area associated with a given ZIP code. This is done because a surprisingly large number of ZIP codes do not actually have any residents. For example, the National Press Building in Washington, D.C., has its own ZIP code solely for postal reasons.
For our purposes, ZIP codes that do not have a corresponding ZCTA population figure are omitted from calculations. These omissions result in some amount of inexactitude but overall do not have a significant effect on resultant averages because proximate ZIP code areas that do have ZCTA population numbers capture the tax rate of those jurisdictions.
Conclusion
Sales taxes are just one part of an overall tax structure and should be considered in context. For example, Tennessee has high sales taxes but no income tax, whereas Oregon has no sales tax but high income taxes. While many factors influence business location and investment decisions, sales taxes are something within policymakers’ control that can have immediate impacts.
Stay informed on the tax policies impacting you.
Subscribe to get insights from our trusted experts delivered straight to your inbox.
[1] Special taxes in Montana’s resort areas are not included in our analysis.
[2] This number includes mandatory add-on taxes that are collected by the state but distributed to local governments. Because of this, some sources will describe California’s sales tax as 6.0 percent. A similar situation exists in Utah and Virginia.
[3] The sales taxes in Hawaii, New Mexico, and South Dakota have bases that include many business services and so are not strictly comparable to other sales taxes.
Property Taxes by State in 2024: Highest to Lowest | The Motley Fool
Property taxes vary widely by state -- find the highest, lowest, and yours here.
By Dann Albright – Updated Mar 18, 2024 at 12:49PM
If you're concerned about long-term wealth, property tax rates can help you figure out where to move or retire. So which states have the highest and lowest property taxes? What about specific counties within those states?
Property tax rates are complicated, but we've made some calculations to summarize them here. It's important to remember that the rates below may not reflect your actual property taxes, which depend on many factors.
Different types of properties have different tax rates, for example, and cities, counties, and school districts all set tax rates. But the figures below average statewide figures to give you a general idea. Let's start with the average property tax by state.
Map: effective property tax rates by state
A quick note before we dive into the data: we calculated the effective property tax rates by state by dividing the median real estate tax paid by the median home value. Both were reported in the 2021 American Community Survey (ACS), the most recently data available. We used the five-year estimates to maximize accuracy.
As an example, the median real estate tax paid in the United States overall was $2,971, while the median home value was $268,800. That makes the effective property tax rate for the United States 1.11%.
Now let's take a look at the state property tax map (to see the median home value and median real estate tax paid, scroll down to any state below):
Here's the same data, presented in descending order by the effective property tax rate of each state, alongside the median property taxes paid:
| Rank | State | Median real estate tax paid | Effective real estate tax rate |
|---|---|---|---|
| 1 | New Jersey | $8,928 | 2.46% |
| 2 | Illinois | $5,213 | 2.29% |
| 3 | Connecticut | $6,251 | 2.16% |
| 4 | New Hampshire | $6,235 | 2.09% |
| 5 | Texas | $4,399 | 1.90% |
| 6 | Vermont | $4,706 | 1.89% |
| 7 | New York | $6,217 | 1.73% |
| 8 | Wisconsin | $3,570 | 1.71% |
| 9 | Nebraska | $3,184 | 1.70% |
| 10 | Iowa | $2,700 | 1.59% |
| 11 | Ohio | $2,658 | 1.57% |
| 12 | Pennsylvania | $3,352 | 1.56% |
| 13 | Rhode Island | $4,526 | 1.54% |
| 14 | Michigan | $2,734 | 1.45% |
| 15 | Kansas | $2,556 | 1.40% |
| 16 | Maine | $2,868 | 1.29% |
| 17 | Alaska | $3,716 | 1.24% |
| 18 | South Dakota | $2,528 | 1.22% |
| 19 | Massachusetts | $5,113 | 1.19% |
| 20 | Minnesota | $2,860 | 1.10% |
| 21 | Maryland | $3,709 | 1.07% |
| 22 | North Dakota | $2,378 | 1.02% |
| 23 | Missouri | $1,830 | 1.00% |
| 24 | Oklahoma | $1,623 | 0.99% |
| 25 | Georgia | $2,151 | 0.95% |
| 26 | Washington | $3,841 | 0.93% |
| 27 | Oregon | $3,457 | 0.92% |
| 28 | Florida | $2,372 | 0.89% |
| 28 | Kentucky | $1,508 | 0.89% |
| 30 | New Mexico | $1,721 | 0.84% |
| 31 | Montana | $2,339 | 0.83% |
| 31 | Indiana | $1,373 | 0.83% |
| 31 | Virginia | $2,656 | 0.83% |
| 34 | California | $4,804 | 0.81% |
| 34 | Mississippi | $1,289 | 0.81% |
| 36 | North Carolina | $1,765 | 0.80% |
| 37 | Arkansas | $1,031 | 0.66% |
| 38 | Tennessee | $1,376 | 0.65% |
| 39 | Idaho | $1,741 | 0.63% |
| 40 | Louisiana | $1,223 | 0.62% |
| 40 | Delaware | $1,695 | 0.62% |
| 42 | Wyoming | $1,501 | 0.61% |
| 43 | Arizona | $1,717 | 0.60% |
| 44 | District of Columbia | $3,754 | 0.59% |
| 44 | West Virginia | $916 | 0.59% |
| 46 | South Carolina | $1,213 | 0.58% |
| 47 | Utah | $1,972 | 0.57% |
| 48 | Nevada | $1,793 | 0.55% |
| 49 | Colorado | $2,125 | 0.52% |
| 50 | Alabama | $742 | 0.43% |
| 51 | Hawaii | $1,915 | 0.29% |
Counties with highest property taxes
In addition to looking at state-level data, the ACS provides county-level property tax information (some of which you can find below under each state). Unfortunately, the ACS only tracks median real estate tax paid up to $10,000, at which point it lists "$10,000+".
14 counties paid a median property tax of $10,000 or more, making them the counties with the highest absolute property taxes paid in the country (we can only estimate their effective property tax rate, as we don't have actual tax data).
All but two of these counties were in New Jersey or New York:
| County | Median home value | Median real estate tax paid |
|---|---|---|
| Marin County, California | $1,146,900 | $10,000+ |
| Bergen County, New Jersey | $501,400 | $10,000+ |
| Essex County, New Jersey | $416,600 | $10,000+ |
| Hunterdon County, New Jersey | $440,100 | $10,000+ |
| Morris County, New Jersey | $480,200 | $10,000+ |
| Passaic County, New Jersey | $363,300 | $10,000+ |
| Union County, New Jersey | $396,500 | $10,000+ |
| Nassau County, New York | $567,200 | $10,000+ |
| New York County, New York | $1,029,900 | $10,000+ |
| Putnam County, New York | $383,300 | $10,000+ |
| Rockland County, New York | $471,000 | $10,000+ |
| Suffolk County, New York | $435,000 | $10,000+ |
| Westchester County, New York | $583,600 | $10,000+ |
| Falls Church city, Virginia | $895,000 | $10,000+ |
Property taxes by state
Now let's take a look at property tax by state.
Alabama property tax
- Effective property tax rate: 0.43%
- Median home value: $172,300
- Median real estate tax paid: $742
The three counties in Alabama with the highest effective property tax rates are Greene County (0.77%), Jefferson County (0.62%), and Mobile County (0.55%). The Alabama counties with the lowest effective property tax rates are Choctaw County (0.21% or less*), Washington County (0.23%), and Bibb and Clarke Counties (0.24%).
Alaska property tax
- Effective property tax rate: 1.24%
- Median home value: $300,100
- Median real estate tax paid: $3,716
The areas in Alaska with the highest property taxes include the Copper River Census Area (2.56%), Bethel Census Area (1.56%), and Anchorage Municipality (1.37%). Much of Alaska does not have a property tax, with four boroughs (Aleutians East, Denali, Lake and Peninsula, and Northwest Arctic) and two Census Areas (Hoonah-Angoon and Kusilvak) showing no real estate taxes paid on the 2021 American Community Survey.
Arizona property tax
- Effective property tax rate: 0.60%
- Median home value: $283,900
- Median real estate tax paid: $1,717
The three counties in Arizona with the highest effective property tax rates are Pima County (0.89%), Yuma County (0.79%), and Santa Cruz County (0.76%). The Arizona counties with the lowest effective property tax rates are Apache County (0.34%), Greenlee County (0.37%), and Coconino County (0.48%).
Arkansas property tax
- Effective property tax rate: 0.66%
- Median home value: $157,300
- Median real estate tax paid: $1,031
The three counties in Arkansas with the highest effective property tax rates are Pulaski County (0.85%), Phillips County (0.82%), and Lafayette County (0.75%). The Arkansas counties with the lowest effective property tax rates are Stone County (0.34%), Searcy County (0.40%), and Randolph and Montgomery Counties (0.41%).
California property tax
- Effective property tax rate: 0.81%
- Median home value: $591,300
- Median real estate tax paid: $4,804
The three counties in California with the highest effective property tax rates are Modoc County (1.07%), Kern County (1.06%), and Riverside County (0.97%). The California counties with the lowest effective property tax rates are Tehama County (0.70%) and Mono, San Mateo, and Inyo Counties (0.71%).
Note that Marin County's real estate tax paid isn't captured accurately by the American Community Survey (it lists only "$10,000+" for median real estate tax paid) so its effective tax rate of 0.87% on a median home value of $1,146,900 may be significantly lower than the actual effective rate.
Colorado property tax
- Effective property tax rate: 0.52%
- Median home value: $407,100
- Median real estate tax paid: $2,125
The three counties in Colorado with the highest effective property tax rates are Kiowa County (0.83%) and Cheyenne and Kit Carson Counties (0.68%). The Colorado counties with the lowest effective property tax rates are Jackson County (0.20%), Greenlee County (0.28%), and San Miguel County (0.29%).
Connecticut property tax
- Effective property tax rate: 2.16%
- Median home value: $289,600
- Median real estate tax paid: $6,251
The three counties in Connecticut with the highest effective property tax rates are Hartford County (2.37%), New Haven County (2.32%), and Tolland County (2.22%). The Connecticut counties with the lowest effective property tax rates are Windham County (1.80%), Fairfield County (1.85%), and New London County (1.90%).
Delaware property tax
- Effective property tax rate: 0.62%
- Median home value: $274,800
- Median real estate tax paid: $1,694
Delaware's three counties have effective tax rates of 0.81% in New Castle County, 0.54% in Kent County, and 0.38% in Sussex County.
District of Columbia property tax
- Effective property tax rate: 0.59%
- Median home value: $636,600
- Median real estate tax paid: $3,754
Florida property tax
- Effective property tax rate: 0.89%
- Median home value: $266,100
- Median real estate tax paid: $2,372
The three counties in Florida with the highest effective property tax rates are Alachua County (1.14%), Broward County (1.05%), and Hendry and St. Lucie Counties (1.04%). The Florida counties with the lowest effective property tax rates are Walton County (0.56%); Monroe County (0.62%); and Jackson, Franklin, and Holmes Counties (0.64%).
Georgia property tax
- Effective property tax rate: 0.95%
- Median home value: $226,600
- Median real estate tax paid: $2,151
The three counties in Georgia with the highest effective property tax rates are Taliaferro County (2.37%), New Haven County (2.32%), and Tolland County (2.22%). The Georgia counties with the lowest effective property tax rates are Windham County (1.80%), Fairfield County (1.85%), and New London County (1.90%).
Hawaii property tax
- Effective property tax rate: 0.29%
- Median home value: $669,200
- Median real estate tax paid: $1,915
The American Community Survey shows four counties with property tax data: Hawaii County (effective property tax rate of 0.32%), Honolulu County (0.30%), Kauai County (0.25%), and Maui County (0.20%). The ACS has no data for Kalawao County.
Idaho property tax
- Effective property tax rate: 0.63%
- Median home value: $277,400
- Median real estate tax paid: $1,741
The three counties in Idaho with the highest effective property tax rates are Power County (0.88%), Bannock County (0.87%), and Nez Perce County (0.86%). The Idaho counties with the lowest effective property tax rates are Idaho County (0.36%), Clark County (0.38%), and Boise County (0.42%).
Illinois property tax
- Effective property tax rate: 2.29%
- Median home value: $227,700
- Median real estate tax paid: $5,213
The three counties in Illinois with the highest effective property tax rates are DeKalb County (2.91%) and Lake and Winnebago Counties (2.90%). The Illinois counties with the lowest effective property tax rates are Pope County (1.16%), Pulaski County (1.17%), and Hardin County (1.37%).
Indiana property tax
- Effective property tax rate: 0.83%
- Median home value: $165,900
- Median real estate tax paid: $1,373
The three counties in Indiana with the highest effective property tax rates are Lake County (1.05%), Marion County (1.01%), and Vigo County (0.98%). The Indiana counties with the lowest effective property tax rates are Pulaski and Clay Counties (0.44%) and Martin County (0.48%).
Iowa property tax
- Effective property tax rate: 1.59%
- Median home value: $169,600
- Median real estate tax paid: $2,700
The three counties in Iowa with the highest effective property tax rates are Polk County (1.93%), Montgomery County (1.90%), and Pottawattamie and Monroe Counties (1.83%). The Iowa counties with the lowest effective property tax rates are Dickinson County (0.96%) and Lyon and Osceola Counties (1.00%).
Kansas property tax
- Effective property tax rate: 1.40%
- Median home value: $182,000
- Median real estate tax paid: $2,556
The three counties in Kansas with the highest effective property tax rates are Stanton County (2.66%), Stevens County (2.53%), and Graham County (2.35%). The Kansas counties with the lowest effective property tax rates are Coffey County (1.06%), Wichita County (1.10%), and Mead and Nemaha Counties (1.12%).
Kentucky property tax
- Effective property tax rate: 0.89%
- Median home value: $169,600
- Median real estate tax paid: $1,508
The three counties in Kentucky with the highest effective property tax rates are Campbell County (1.24%), Greenup County (1.19%), and Kenton County (1.16%). The Kentucky counties with the lowest effective property tax rates are Carter and Grayson Counties (0.60%) and Casey County (0.61%).
Louisiana property tax
- Effective property tax rate: 0.62%
- Median home value: $196,000
- Median real estate tax paid: $1,223
The three parishes in Louisiana with the highest effective property tax rates are Orleans Parish (0.87%), St. Tammany Parish (0.80%), and Caddo Parish (0.79%). The Louisiana parishes with the lowest effective property tax rates are East Feliciana Parish (0.15%), Catahoula Parish (0.22%), and West Carroll Parish (0.25%).
Maine property tax
- Effective property tax rate: 1.29%
- Median home value: $223,100
- Median real estate tax paid: $2,868
The three counties in Maine with the highest effective property tax rates are Androscoggin County (1.54%), Penobscot County (1.48%), and Knox County (1.42%). The Maine counties with the lowest effective property tax rates are Hancock County (1.05%), Lincoln County (1.09%), and Piscataquis County (1.12%).
Maryland property tax
- Effective property tax rate: 1.07%
- Median home value: $346,500
- Median real estate tax paid: $3,709
The three counties in Maryland with the highest effective property tax rates are Howard County (1.29%), Prince George's County (1.24%), and Baltimore County (1.19%). The effective property tax rate of Baltimore city, which is reported separately, is 1.63%. The Maryland counties with the lowest effective property tax rates are Talbot County (0.72%), Worcester County (0.82%), and Queen Anne's County (0.86%).
Massachusetts property tax
- Effective property tax rate: 1.19%
- Median home value: $431,100
- Median real estate tax paid: $5,113
The three counties in Massachusetts with the highest effective property tax rates are Franklin County (1.66%), Hampden County (1.65%), and Hampshire County (1.59%). The Massachusetts counties with the lowest effective property tax rates are Nantucket County (0.32%), Dukes County (0.51%), and Suffolk County (0.68%).
Michigan property tax
- Effective property tax rate: 1.45%
- Median home value: $188,300
- Median real estate tax paid: $2,734
The three counties in Michigan with the highest effective property tax rates are Ingham County (2.03%), Wayne County (1.82%), and Gogebic County (1.78%). The Michigan counties with the lowest effective property tax rates are Leelanau County (0.80%), Benzie County (0.88%), and Alcona County (0.92%).
Minnesota property tax
- Effective property tax rate: 1.10%
- Median home value: $260,500
- Median real estate tax paid: $2,860
The three counties in Minnesota with the highest effective property tax rates are Steele County (1.29%), Ramsey County (1.28%), and Chisago County (1.26%). The Minnesota counties with the lowest effective property tax rates are Aitkin County (0.59%), Cass County (0.63%), and Rock County (0.69%).
Mississippi property tax
- Effective property tax rate: 0.81%
- Median home value: $159,200
- Median real estate tax paid: $1,289
The three counties in Mississippi with the highest effective property tax rates are Humphreys County (1.78%), Quitman County (1.53%), and Leflore County (1.30%). The Mississippi counties with the lowest effective property tax rates are Amite County (0.47%), Choctaw County (0.54%), and Perry County (0.56%).
Missouri property tax
- Effective property tax rate: 1.00%
- Median home value: $183,900
- Median real estate tax paid: $1,830
The three counties in Missouri with the highest effective property tax rates are Worth County (1.41%), St. Louis County (1.31%), and Putnam County (1.29%). The Missouri counties with the lowest effective property tax rates are Douglas County (0.45%) and Reynolds and Dallas Counties (0.48%).
Montana property tax
- Effective property tax rate: 0.83%
- Median home value: $282,200
- Median real estate tax paid: $2,339
The three counties in Montana with the highest effective property tax rates are Liberty County (1.36%), Dawson County (1.29%), and Blaine County (1.16%). The Montana counties with the lowest effective property tax rates are Judith Basin County (0.43%), Madison County (0.49%), and Sanders County (0.53%).
Note that Petroleum and Prairie Counties don't have median home values listed in the 2021 ACS, so their effective tax rate can't be calculated from the data.
Nebraska property tax
- Effective property tax rate: 1.70%
- Median home value: $187,700
- Median real estate tax paid: $3,184
The three counties in Nebraska with the highest effective property tax rates are Kimball County (2.02%), Sarpy County (1.99%), and Cheyenne County (1.98%). The Nebraska counties with the lowest effective property tax rates are Loup County (0.69%), Grant County (0.79%), and Keya Paha County (0.80%).
Nevada property tax
- Effective property tax rate: 0.55%
- Median home value: $325,300
- Median real estate tax paid: $1,793
The three counties in Nevada with the highest effective property tax rates are Lincoln County (0.79%), Lander County (0.72%), and Mineral County (0.71%). The Nevada counties with the lowest effective property tax rates are Esmeralda County (0.33%), Eureka County (0.39%), and Washoe County (0.52%). Carson City has an effective property tax rate of 0.47%.
New Hampshire property tax
- Effective property tax rate: 2.09%
- Median home value: $297,900
- Median real estate tax paid: $6,235
The three counties in New Hampshire with the highest effective property tax rates are Sullivan County (2.84%), Cheshire County (2.68%), and Merrimack County (2.37%). The New Hampshire counties with the lowest effective property tax rates are Carroll County (1.28%), Belknap County (1.77%), and Rockingham County (1.86%).
New Jersey property tax
- Effective property tax rate: 2.46%
- Median home value: $363,400
- Median real estate tax paid: $8,928
Six counties in New Jersey (Bergen, Essex, Hunterdon, Morris, Passaic, and Union Counties) have a median real estate tax paid of "$10,000+" in the American Community Survey, making New Jersey's county-level property taxes difficult to calculate exactly. What's certain is that these counties pay some of the highest total property taxes in the country.
For the following statistics, we've used $10,000 as the median real estate tax paid in these counties (but this likely underestimates the effective rate, possibly by a substantial margin).
The three counties in New Jersey with the highest effective property tax rates are Camden County (3.45%), Salem County (3.25%), and Gloucester County (3.09%). The New Jersey counties with the lowest effective property tax rates are Cape May County (1.54%), Hudson County (1.97%), and Bergen County (1.99%).
New Mexico property tax
- Effective property tax rate: 0.84%
- Median home value: $204,400
- Median real estate tax paid: $1,721
The three counties in New Mexico with the highest effective property tax rates are McKinley County (1.18%), Bernalillo County (1.05%), and Sandoval County (0.87%). The New Mexico counties with the lowest effective property tax rates are Harding County (0.42%); De Baca County (0.44%); and Hidalgo, Taos, and Mora Counties (0.46%).
Note that the ACS does not have median home values for Catron and Guadalupe Counties.
New York property tax
- Effective property tax rate: 1.73%
- Median home value: $359,600
- Median real estate tax paid: $6,217
Like New Jersey, New York has six counties (Nassau, New York, Putnam, Rockland, Suffolk, and Westchester Counties) that the ACS reports "$10,000+" for median real estate tax paid. We used $10,000 for the calculations of those counties, though this may significantly underestimate the effective tax rate (especially for New York county, where the median home value is $1,029,900).
The three counties in New York with the highest effective property tax rates are Allegany County (3.48%), Orleans County (3.21%), and Monroe County (3.16%). The New York counties with the lowest effective property tax rates are Kings County (0.66%), Queens County (0.86%), and Richmond County (0.83%).
North Carolina property tax
- Effective property tax rate: 0.80%
- Median home value: $220,000
- Median real estate tax paid: $1,765
The three counties in North Carolina with the highest effective property tax rates are Washington and Edgecombe Counties (1.20%) and Scotland County (1.15%). The North Carolina counties with the lowest effective property tax rates are Jackson County (0.38%) and Clay and Swain Counties (0.42%).
Note that the ACS does not have median real estate tax paid for Hyde County.
North Dakota property tax
- Effective property tax rate: 1.02%
- Median home value: $233,300
- Median real estate tax paid: $2,378
The three counties in North Dakota with the highest effective property tax rates are Stutsman County (1.25%), Cass County (1.22%), and Ransom County (1.21%). The North Dakota counties with the lowest effective property tax rates are Slope County (0.23%), McKenzie County (0.44%), and Kidder County (0.47%).
Note that the ACS does not have median real estate tax paid for Sioux County.
Ohio property tax
- Effective property tax rate: 1.57%
- Median home value: $169,200
- Median real estate tax paid: $2,658
The three counties in Ohio with the highest effective property tax rates are Cuyahoga County (2.31%), Montgomery County (2.07%), and Lucas County (1.98%). The Ohio counties with the lowest effective property tax rates are Noble County (0.88%), Wyandot County (0.89%), and Monroe County (0.90%).
Oklahoma property tax
- Effective property tax rate: 0.99%
- Median home value: $164,500
- Median real estate tax paid: $1,623
The three counties in Oklahoma with the highest effective property tax rates are Cleveland County (1.21%), Tulsa County (1.15%), and Oklahoma County (1.12%). The Oklahoma counties with the lowest effective property tax rates are Roger Mills County (0.51%) and Pushmataha and McCurtain Counties (0.53%).
Oregon property tax
- Effective property tax rate: 0.92%
- Median home value: $373,900
- Median real estate tax paid: $3,457
The three counties in Oregon with the highest effective property tax rates are Harney County (1.18%), Malheur County (1.10%), and Umatilla County (1.08%). The Oregon counties with the lowest effective property tax rates are Curry County (0.58%), Josephine County (0.59%), and Tillamook County (0.62%).
Pennsylvania property tax
- Effective property tax rate: 1.56%
- Median home value: $215,300
- Median real estate tax paid: $3,352
The three counties in Pennsylvania with the highest effective property tax rates are Monroe County (2.32%), Delaware County (2.15%), and Berks County (2.00%). The Pennsylvania counties with the lowest effective property tax rates are Bedford County (0.83%), Philadelphia County (0.94%), and Huntingdon County (0.99%).
Rhode Island property tax
- Effective property tax rate: 1.54%
- Median home value: $293,100
- Median real estate tax paid: $4,526
The five counties in Rhode Island have the following effective property tax rates: 1.72% in Kent County, 1.63% in Bristol County, 1.62% in Providence County, 1.21% in Washington County, and 1.14% in Newport County.
South Carolina property tax
- Effective property tax rate: 0.58%
- Median home value: $207,400
- Median real estate tax paid: $1,213
The three counties in South Carolina with the highest effective property tax rates are Hampton County (0.96%), Williamsburg County (0.82%), and Richland County (0.81%). The South Carolina counties with the lowest effective property tax rates are Horry County (0.37%) and Charleston, Florence, and Darlington Counties (0.46%).
South Dakota property tax
- Effective property tax rate: 1.22%
- Median home value: $207,700
- Median real estate tax paid: $2,528
The three counties in South Dakota with the highest effective property tax rates are Todd County (2.38%), Mellette County (2.00%), and Bennett County (1.67%). The South Dakota counties with the lowest effective property tax rates are Ziebach County (0.56%) and Marshall and Custer Counties (0.82%).
Note that the ACS does not have median real estate tax paid for Buffalo, Jackson, or Ogalala Counties or median home value for Buffalo County.
Tennessee property tax
- Effective property tax rate: 0.65%
- Median home value: $211,700
- Median real estate tax paid: $1,376
The three counties in Tennessee with the highest effective property tax rates are Shelby County (1.25%), Montgomery County (0.81%), and Gibson County (0.80%). The Tennessee counties with the lowest effective property tax rates are Sevier County (0.37%) and Cumberland and DeKalb Counties (0.38%).
Texas property taxes
- Effective property tax rate: 1.90%
- Median home value: $232,000
- Median real estate tax paid: $4,399
The three counties in Texas with the highest effective property tax rates are Mitchell County (2.72%), Sherman County (2.51%), and El Paso County (2.42%). The Texas counties with the lowest effective property tax rates are Glasscock County (0.16%), Ward County (0.37%), and Leon County (0.72%).
Note that the ACS does include median real estate tax paid for Crockett, Culberson, Dimmit, Kenedy, King, LaSalle, Loving, McMullen, Sterling, or Zavala Counties. Also not included are median home values for Dimmit, Kenedy, Kent, King, or Loving Counties.
Utah property tax
- Effective property tax rate: 0.57%
- Median home value: $345,300
- Median real estate tax paid: $1,972
The three counties in Utah with the highest effective property tax rates are Duchesne County (0.73%), Carbon County (0.70%), and Sevier and Weber Counties (0.67%). The Utah counties with the lowest effective property tax rates are Summit County (0.38%) and Garfield and Rich Counties (0.40%).
Vermont property tax
- Effective property tax rate: 1.89%
- Median home value: $248,700
- Median real estate tax paid: $4,706
The three counties in Vermont with the highest effective property tax rates are Rutland County (2.15%), Windham County (2.13%), and Windsor County (2.11%). The Vermont counties with the lowest effective property tax rates are Grand Isle County (1.62%), Franklin County (1.69%), and Chittenden County (1.80%).
Virginia property tax
- Effective property tax rate: 0.83%
- Median home value: $321,200
- Median real estate tax paid: $2,656
Virginia has 38 independent cities that are considered equivalent to counties for census data. We've treated them as counties here. In general, though not in every case, the cities' effective tax rates are higher than the counties'.
The three cities in Virginia with the highest effective property tax rates are Manassas Park city (1.24%), Portsmouth city (1.17%), and Roanoke city (1.15%). The Virginia counties with the lowest effective property tax rates are Craig County (0.38%), Buchanan County (0.45%), and Nottoway County (0.46%).
Note that Falls Church city's real estate tax paid isn't captured accurately by the American Community Survey (it lists only "$10,000+" for median real estate tax paid) so its effective tax rate of 1.12% on a median home value of $895,300 may be significantly lower than the actual effective rate.
Washington property tax
- Effective property tax rate: 0.93%
- Median home value: $414,300
- Median real estate tax paid: $3,841
The three counties in Washington with the highest effective property tax rates are Pierce County (1.04%), Walla Walla County (1.03%), and Grant County (1.02%). The Washington counties with the lowest effective property tax rates are Wahkiakum County (0.62%) and Pend Oreille and San Juan Counties (0.63%).
Related retirement topics
West Virginia property tax
- Effective property tax rate: 0.59%
- Median home value: $156,000
- Median real estate tax paid: $916
The three counties in West Virginia with the highest effective property tax rates are Wetzel County (0.81%), Hancock County (0.78%), and Cabell County (0.75%). The West Virginia counties with the lowest effective property tax rates are Pocahontas County (0.30%), Roane County (0.34%), and Summers County (0.36%).
Wisconsin property tax
- Effective property tax rate: 1.71%
- Median home value: $208,900
- Median real estate tax paid: $3,570
The three counties in Wisconsin with the highest effective property tax rates are Milwaukee County (2.34%), Menominee County (2.32%), and Rock County (1.97%). The Wisconsin counties with the lowest effective property tax rates are Vilas County (0.82%), Sawyer County (0.96%), and Oneida County (1.05%).
Wyoming property tax
- Effective tax rate: 0.61%
- Median home value: $247,600
- Median real estate tax paid: $1,501
The three counties in Wyoming with the highest effective property tax rates are Washakie County (0.71%), Platte County (0.70%), and Goshen County (0.69%). The Wyoming counties with the lowest effective property tax rates are Sublette County (0.44%), Teton County (0.45%), and Lincoln County (0.50%).
FAQs
When it comes to dollar amounts, New Jersey ($8,928), Connecticut ($6,251), New Hampshire ($6,235), New York ($6,217), and Illinois ($5,213) have the highest median property taxes.
If you're looking at the highest effective tax rates, however, you'll find that New Jersey (2.46%), Illinois (2.29%), Connecticut (2.16%), New Hampshire (2.09%), and Texas (1.90%) top the list.
By median real estate taxes paid in absolute dollars, Alabama ($742), West Virginia ($916), Arkansas ($1,031), South Carolina ($1,213), and Louisiana ($1,223) have the lowest property taxes.
When ranking by the lowest effective tax rates, the list looks like this: Hawaii (0.29%), Alabama (0.43%), Colorado (0.52%), Nevada (0.55%), and Utah (0.57%).
As of early 2023, there are no states without property taxes. There are some small exceptions, though, such as Alaska. Much of the landmass of the state has no property tax, largely because of its sparse population.
Planning for property taxes
Understanding your likely property tax burden can be important if you're looking for the best state to retire to or just considering a move somewhere else in the country. The above figures are generalizations, but can help you get an idea of what most people pay.
And if you're looking at property taxes by state as part of your retirement planning, be sure to check out Rule Your Retirement for tips on taxes, saving strategies, investing, and more.
Sources
- U.S. Census Bureau (2022). American Community Survey, Table S2506, Financial Characteristics for Housing Units With a Mortgage.
The Motley Fool has a disclosure policy.


Comments
Post a Comment