UC System Faces a Cloudy Future with Contrary Winds Expected
 |
| Three Decade Trends in UC Applicants, Admits, and Enrollees |
UC System Faces a Cloudy Future with Contrary Winds ExpectedThe University of California's ambitious $30 billion expansion program appears strategically sound despite projected demographic declines, primarily due to increasing college preparation rates among high school graduates and the system's unique position to serve historically underrepresented regions, according to a comprehensive analysis of enrollment and capacity data.
While California's overall college enrollment is expected to plateau and then decline after 2035, UC specifically is projected to maintain robust growth, driven by a dramatic increase in the percentage of high school students completing college preparatory requirements – from 37% to 52% over the past decade.
"This isn't just about adding seats – it's about strategic growth where it's needed most," said [would cite expert here]. Nearly two-thirds of UC's projected expansion will occur at UC Merced and UC Riverside, specifically targeting the underserved San Joaquin Valley and Inland Empire regions.
The expansion comes as the system faces critical infrastructure needs, with many campus buildings dating to the 1950s and 1960s requiring $16 billion in seismic retrofits. These safety and modernization requirements would need to be addressed regardless of enrollment growth, making the timing appropriate for comprehensive campus improvements.
UC's 2030 Capacity Plan outlines two growth scenarios: a base plan to add 23,000 state-supported undergraduate students and an aspirational goal of 33,000 additional students. Unlike community colleges, which are more dependent on local demographics, UC's ability to draw students from across California helps insulate it from regional population shifts.
The system is also taking steps to maximize existing capacity through increased online and summer offerings, improved graduation rates, and enhanced transfer pathways from community colleges. These efficiency measures complement physical expansion plans.
However, significant challenges remain. The system hasn't received state General Obligation bonds since 2006, forcing reliance on a complex mixture of funding sources including loans, private investment, and student fees. Current budget uncertainties and local opposition to campus expansion projects could also impact implementation timelines.
Housing remains a particular concern, with the system currently accommodating 40% of students. While new housing projects can be self-funding through future rent revenues, several campuses have stressed the need to align enrollment growth with additional bed spaces.
The expansion faces additional hurdles at some of the system's most popular campuses. UC Berkeley, for example, projects growth of 8,100 students through 2036 but faces capacity constraints, strict local sustainability goals, and neighborhood opposition that may limit increases.
Multiple infrastructure projects are legally mandated, particularly seismic upgrades to medical facilities, making some aspects of the expansion non-discretionary. The system's medical facilities represent a significant portion of the construction plans.
Looking ahead, UC's ability to execute its expansion will depend heavily on securing sustainable funding sources and potentially accelerating alternative growth strategies. While demographic trends suggest challenges for higher education broadly in California, UC's specific market position and strategic focus on underserved regions appear to justify its ambitious plans.
1. Demographic & Enrollment Projections:
- - Overall college enrollment in CA will increase slightly through 2035, then decline
- - UC specifically is projected to see robust enrollment growth due to:
- - Increasing A-G completion rates (up from 37% to 52% of HS graduates)
- - Strong student demand, especially at selective campuses
- - System's ability to draw students from across regions
- - Unlike community colleges, UC is less vulnerable to local population changes
- - Critical seismic and modernization needs remain valid regardless of enrollment:
- - Many buildings from 1950s/60s require upgrades
- - $16B in seismic retrofits needed for safety/compliance
- - UC has legal obligations to strengthen medical facilities
- - Housing expansion is strategic:
- - Currently houses 40% of students
- - Housing capacity helps attract/retain students in expensive markets
- - Housing projects can be self-funding through rents
- - UC's 2030 Capacity Plan has two scenarios:
- - Base: Add 23,000 state-supported undergraduate FTE students
- - Aspirational: Add 33,000 state-supported undergraduate FTE students
- - Growth focused strategically on:
- - UC Merced and UC Riverside (65% of projected growth)
- - Expanding access in underserved San Joaquin Valley and Inland Empire
- - Complemented by efficiency measures:
- - Increased online/summer offerings
- - Improved graduation rates
- - Enhanced transfer pathways
- - Funding challenges are significant:
- - No state General Obligation bonds since 2006
- - Complex blend of funding needed (bonds, loans, private investment, fees)
- - Current budget uncertainty may impact near-term support
- - But UC has more diverse funding options than CSU/CCC:
- - Greater access to philanthropy
- - More revenue-generating opportunities
- - Stronger borrowing capacity
Conclusion:
The UC expansion actually appears justified, despite demographic headwinds. The growth is:- Demand-Driven: Increasing A-G completion rates and strong applications suggest sustained demand for UC specifically, even as overall college enrollment may plateau
- Strategically Targeted: Focus on underserved regions and campuses with room to grow, rather than just expanding already-impacted campuses
- Infrastructure-Justified: Many projects address critical safety and modernization needs that exist regardless of enrollment growth
- Equity-Enhancing: Expansion plans could help close geographic and demographic gaps in UC access
- - Uncertain state funding support
- - Need for sustainable financing mechanisms
- - Local opposition/CEQA challenges at some campuses
- - Housing capacity constraints
UC faces half-billion-dollar budget shortfall and increases tuition for new nonresident students | KPBS Public Media
The University of California is eyeing a looming budget gap of half a billion dollars next year. To help balance the books it’s relying in part on its out-of-state undergraduates.
Meanwhile, the system is pouring tens of billions of dollars into construction projects for seismic retrofitting, new classrooms and medical centers — while also acknowledging it lacks the funding to build or renovate most of what it needs.
Out-of-state undergraduates at the UC are charged more than three times the total tuition in-state students are expected to pay. Now system leaders have increased the supplemental tuition for new non-resident undergraduates by $3,402 next fall, an amount that’s $2,208 more than what the supplemental tuition would increase by under existing UC policy.
A UC regents committee approved the new hike Wednesday; the full board voted to greenlight the measure today.
One regent, Jose M. Hernandez, voted no. Two elected state leaders on the board, Lt. Gov. Eleni Kounalakis and Assembly Speaker Robert Rivas, abstained from voting.
“I just want to be on the record opposing the tuition increase, and also on the record recognizing the commitment of staff to continue to work to evaluate and understand these decisions to increase the cost of attendance for out of state students,” Kounalakis said today.
Under a model passed in 2021, each new cohort of undergraduates sees higher tuition and fees than the previous crop of new students but that tuition stays flat for their time at the UC. In-state students are charged tuition and a systemwide fee. Out-of-state students are charged that plus a much larger supplemental fee. The base tuition and fee would go up as planned under the 2022 model; only the supplemental fee would rise at a higher than expected amount.
All told, it would mean new nonresident undergraduates would pay $52,536 in total mandatory tuition next fall, excluding separate campus fees that are an average of $1,700. Current new nonresident undergraduates pay $48,636 annually, plus campus fees.
The move would affect the roughly 15% of UC undergraduates, including transfer students, who live outside of California and will begin their studies at the university system next fall. The increase wouldn’t affect current students or future graduate students.
“As UC prepares for an anticipated state budget cut that could impact student services across the entire system, we are proposing an increase to support core operations without raising costs for current students and California residents,” wrote UC spokesperson Omar Rodriguez in an email.
“Opportunity to higher education should not face any more barriers. Instead of increasing the salaries of UC administrators, let’s make sure college is more affordable for all.”Eduardo Tapia Jr-Urbieta, executive officer for the UC Student Association
The hike would increase revenue by about $41 million for the system annually, Rodriguez wrote.
The impending half-billion shortfall next summer would occur if state lawmakers and Gov. Gavin Newsom make good on a deal to delay previously promised new money for the UC and apply a cut to its state support.
UC’s operating revenue is estimated to be about $53 billion in 2024-25. Most of that is from the system’s medical services work, including hospitals. Its core mission of educating students, largely faculty salary and benefits as well as financial aid, makes up about $11 billion of the system’s budget. That amount is almost evenly paid for with state dollars and a combination of tuition revenue and other university funds.
It’s among the numerous fiscal details that emerged at the regents’ regularly scheduled November meeting, including the revelation that the UC plans to spend $30 billion to repair or replace its increasingly aging stock of academic buildings, medical centers and dorms by decade’s end. And yet, that massive sum falls far short of the 10-campus system’s stated construction needs — a total of $53 billion in projects without a funding source.
The building spree is occurring as UC trundles toward a goal of adding 23,000 new California students by 2030 — fueled in part by lawmaker demands that the vaunted system make space for more California high schoolers.
The tuition hike in context
In some ways the emphasis on out-of-state students is a return to form for the UC, which both relies on these students for the much higher tuition they pay but also is under pressure by lawmakers to limit how many non-Californian undergraduates the system enrolls.
Eduardo Tapia Jr-Urbieta, an executive officer for the UC Student Association, which represents undergraduate students, said that the student association opposes the increase. “Opportunity to higher education should not face any more barriers. Instead of increasing the salaries of UC administrators, let’s make sure college is more affordable for all,” he told regents yesterday.
Those September raises came in two waves: 4.2% for senior UC officials, such as the system president and most campus chancellors, and extra raises, including for most of the chancellors — ranging from 16% to 33%. The extra chancellor raises are paid with private donations, not tuition or state support. The updated chancellor salaries range from $785,000 to nearly $1.2 million
Nonresident undergraduate students tend to have higher family incomes than resident students. In 2021, 45% of nonresident undergraduates had family incomes of above $185,000. The same was true for 25% of undergraduates from California. Nearly three-quarters of nonresident undergraduates came from households exceeding $93,000; for California-based undergrads, it was 45%.
Still, nonresident students on average pay much more to attend a UC campus, even after all financial aid is factored into their costs. The net price — which includes tuition, housing and other related costs minus grants and scholarships — for resident undergraduates with household incomes above $180,000 was around $37,000 a year last fall. For nonresident undergraduates, the average net price was $67,000.
“I support it (the nonresident tuition increase). I’ll get pushback for that, but here we are,” said Josiah Beharry, a student regent who can cast a vote on the board.
UC officials said that compared to some other major public universities, UC’s nonresident undergraduates pay lower nonresident fees. For example, University of Michigan nonresident students paid $11,500 more than their nonresident UC peers in 2023-24. University of Virginia nonresident undergraduate paid $7,000 more. Even when adjusting for living costs, nonresident Californians are charged less for their education, UC officials said.
UC policy permits 20% of new nonresident tuition revenue to be reserved for financial aid for nonresident undergraduates.
$30 billion in planned construction
The $30 billion construction plan — and $50 billion in projects without a funding source — were spelled out in a new, 207-page report detailing construction plans that UC budget officials presented to the system’s regents yesterday.
“The University’s enrollment growth and continuing needs for renewal, modernization and seismic correction of existing facilities are the key drivers of capital investments,” the report said.
Cranes have been soaring above the system’s campus skylines for years.
Since 2011, the UC has added beds for 42,000 students, growing from nearly 75,000 beds. The increase means the system can house 40% of its students, up from 32% a decade ago.
And UC isn’t done as it’s on track to build dorm space for 14,000 new beds at all nine undergraduate-serving campuses through 2030 — at a cost of $6.9 billion. That’s nearly half-a-million-dollars per bed.
But while student housing projects can largely pay for themselves over time through the rents campuses charge, classroom buildings have fewer sources of cash beyond system bonds and state dollars — which the UC says are hardly enough to meet campus needs.
Take for example all the seismic repairs UC says it must undergo to extend the life of its buildings, with structures built in the 1950s and 1960s representing the largest chunk of UC’s gargantuan building footprint. UC has $16 billion in seismic retrofit needs but only identified funding for 16% of that, or $2.5 billion, last academic year.
“I support it (the nonresident tuition increase). I’ll get pushback for that, but here we are.”Josiah Beharry, UC student regent
It’s not just finding money that’s a concern for UC. As buildings undergo remodeling, the classrooms, research and other activity core to the system’s mission has to continue. “The scope and complexity of planning required to minimize these disruptions can often necessitate the construction of temporary or replacement space,” the report read.
The scale of the need is vast. According to the UC, about 1,464 buildings require seismic upgrades across the system.
UC officials disclosed yesterday that the system is debuting a new plan in which campuses will reduce its backlog of structures that need seismic upgrades by 4% annually, with the structures most in need of an overhaul receiving priority.
And then there’s all the new construction UC needs. The system completed 139 projects at a cost of $1.4 billion last academic year — but has more than $20 billion in active construction plans for about 400 projects. More than half of those are for UC’s extensive medical care operation, in part to satisfy state rules on strengthening hospitals to better withstand earthquakes.
Through 2030, UC’s construction plans total $30 billion, with about $12 billion for its medical centers. Philanthropy helps pay for all those projects, but only a little. Just about $2 billion of the construction plan budget will come from gifts. About $300 million will come from state funds directly — a relatively tiny portion of the overall revenue picture for the system’s six-year building plan. Much of the projects will be paid for with external financing, such as bonds that the system sells to investors.
But that’s just projects with a funding source. UC Berkeley, for example, has more than $14 billion in construction needs but has identified the funding for just about $2.8 billion of that.
What is getting built at the system’s oldest campus? For starters, a new undergraduate academic building that’ll include 27 classrooms and a 400-seat auditorium with a rooftop terrace. All of that costs $137 million. It’s scheduled to open in the 2025-26 academic year.
Tuition & cost of attendance
Going to college is an investment - but it’s worth it. We have generous financial aid programs and predictable tuition costs year-to-year that help to bring a UC education within reach.
Nearly 70% of our California undergrads get an average of $20,000 in grants and scholarships to help with costs, including UC tuition, food and housing, transportation, books and supplies.
Even if you don’t qualify for financial aid, UC’s Tuition Stability Plan keeps your tuition the same for up to six years. Tuition stability applies to both California resident and nonresident students and helps you plan for the total cost of your UC education.
Estimated average costs for California residents, 2025–26
This chart estimates the cost of attending UC for one year as a new California resident undergraduate. For a significant proportion of our students, these expenses are offset by grants and scholarships.
Keep in mind that your total cost will vary depending on your personal expenses and the campus you attend.
| Direct costs | On campus | Off campus |
| UC Tuition | $14,934 | $14,934 |
| Campus fees | $1,700 | $1,700 |
| Campus housing and meals | $20,500 | |
| Health insurance allowance/fee | $3,500 | $3,500 |
| Total direct costs | $40,634 | $20,134 |
|
|
||
| Indirect costs | On campus | Off campus |
| Books and supplies | $1,400 | $1,400 |
| Housing & meals | $18,000 | |
| Personal transportation | $3,200 | $4,100 |
| Total indirect costs | $4,600 | $23,500 |
|
|
||
| TOTAL COST (direct and indirect) | $45,234 | $43,634 |
* UC Tuition remains flat for up to six years under the Tuition Stability Plan. It includes systemwide tuition (the cost of classes for California resident students), and student services fees for areas such as student government, student public transportation, and building improvements. These fees are set regardless of the method of instruction and will not be refunded in the event instruction occurs remotely for any part of the academic year.
Estimated average costs for nonresidents, 2025–26
This chart estimates the cost of attending UC for one year as a new nonresident undergraduate. UC tuition includes $34,200 in nonresident supplemental tuition. Keep in mind that your total cost will vary depending on your personal expenses and the campus you attend.
| Direct costs | On campus | Off campus |
| UC Tuition | $50,328 | $50,328 |
| Campus fees | $1,700 | $1,700 |
| Campus housing and meals | $20,500 | |
| Health insurance allowance/fee | $3,500 | $3,500 |
| Total direct costs | $76,028 | $55,528 |
|
|
||
| Indirect costs | On campus | Off campus |
| Books and supplies | $1,400 | $1,400 |
| Housing & meals | $18,000 | |
| Personal transportation | $3,200 | $4,100 |
| Total indirect costs | $4,600 | $23,500 |
|
|
||
| TOTAL COST (direct and indirect) | $80,628 | $79,028 |
* UC Tuition remains flat for up to six years under the Tuition Stability Plan. For non-residents, this includes systemwide tuition (the cost of classes for CA resident students), supplemental nonresident tuition, and student services fees for areas such as student government, student public transportation, and building improvements. These fees are set regardless of the method of instruction and will not be refunded in the event instruction occurs remotely for any art of the academic year.
Understanding California residency
If you're not sure whether you're a resident or a nonresident, review the policies:
California residence for the purposes of tuition and fees »
Good to know
Obtaining California residency for the purposes of tuition and fees is extremely difficult for undergraduates with nonresident parents (this includes transfer students from community colleges and other postsecondary institutions within California).
Virtually all nonresident undergraduates with nonresident parents remain nonresidents for the duration of their undergraduate career at UC.
UC faces half-billion-dollar budget shortfall and increases tuition for new nonresident students
In summary
The University of California anticipates more than a $500 million budget gap next summer, so It’s increasing tuition by at least $3,402 for new nonresident students next fall. Meanwhile, the system is planning billions in construction projects.
The University of California is eyeing a looming budget gap of half a billion dollars next year. To help balance the books it’s relying in part on its out-of-state undergraduates.
Meanwhile, the system is pouring tens of billions of dollars into construction projects for seismic retrofitting, new classrooms and medical centers — while also acknowledging it lacks the funding to build or renovate most of what it needs.
Out-of-state undergraduates at the UC are charged more than three times the total tuition in-state students are expected to pay. Now system leaders have increased the supplemental tuition for new non-resident undergraduates by $3,402 next fall, an amount that’s $2,208 more than what the supplemental tuition would increase by under existing UC policy.
A UC regents committee approved the new hike Wednesday; the full board voted to greenlight the measure today.
One regent, Jose M. Hernandez, voted no. Two elected state leaders on the board, Lt. Gov. Eleni Kounalakis and Assembly Speaker Robert Rivas, abstained from voting.
“I just want to be on the record opposing the tuition increase, and also on the record recognizing the commitment of staff to continue to work to evaluate and understand these decisions to increase the cost of attendance for out of state students,” Kounalakis said today.
Under a model passed in 2021, each new cohort of undergraduates sees higher tuition and fees than the previous crop of new students but that tuition stays flat for their time at the UC. In-state students are charged tuition and a systemwide fee. Out-of-state students are charged that plus a much larger supplemental fee. The base tuition and fee would go up as planned under the 2022 model; only the supplemental fee would rise at a higher than expected amount.
All told, it would mean new nonresident undergraduates would pay $52,536 in total mandatory tuition next fall, excluding separate campus fees that are an average of $1,700. Current new nonresident undergraduates pay $48,636 annually, plus campus fees.
The move would affect the roughly 15% of UC undergraduates, including transfer students, who live outside of California and will begin their studies at the university system next fall. The increase wouldn’t affect current students or future graduate students.
“As UC prepares for an anticipated state budget cut that could impact student services across the entire system, we are proposing an increase to support core operations without raising costs for current students and California residents,” wrote UC spokesperson Omar Rodriguez in an email.
“Opportunity to higher education should not face any more barriers. Instead of increasing the salaries of UC administrators, let’s make sure college is more affordable for all.”
Eduardo Tapia Jr-Urbieta, executive officer for the UC Student Association
The hike would increase revenue by about $41 million for the system annually, Rodriguez wrote.
The impending half-billion shortfall next summer would occur if state lawmakers and Gov. Gavin Newsom make good on a deal to delay previously promised new money for the UC and apply a cut to its state support.
UC’s operating revenue is estimated to be about $53 billion in 2024-25. Most of that is from the system’s medical services work, including hospitals. Its core mission of educating students, largely faculty salary and benefits as well as financial aid, makes up about $11 billion of the system’s budget. That amount is almost evenly paid for with state dollars and a combination of tuition revenue and other university funds.
It’s among the numerous fiscal details that emerged at the regents’ regularly scheduled November meeting, including the revelation that the UC plans to spend $30 billion to repair or replace its increasingly aging stock of academic buildings, medical centers and dorms by decade’s end. And yet, that massive sum falls far short of the 10-campus system’s stated construction needs — a total of $53 billion in projects without a funding source.
The building spree is occurring as UC trundles toward a goal of adding 23,000 new California students by 2030 — fueled in part by lawmaker demands that the vaunted system make space for more California high schoolers.
The tuition hike in context
In some ways the emphasis on out-of-state students is a return to form for the UC, which both relies on these students for the much higher tuition they pay but also is under pressure by lawmakers to limit how many non-Californian undergraduates the system enrolls.
Eduardo Tapia Jr-Urbieta, an executive officer for the UC Student Association, which represents undergraduate students, said that the student association opposes the increase. “Opportunity to higher education should not face any more barriers. Instead of increasing the salaries of UC administrators, let’s make sure college is more affordable for all,” he told regents yesterday.
Those September raises came in two waves: 4.2% for senior UC officials, such as the system president and most campus chancellors, and extra raises, including for most of the chancellors — ranging from 16% to 33%. The extra chancellor raises are paid with private donations, not tuition or state support. The updated chancellor salaries range from $785,000 to nearly $1.2 million
Nonresident undergraduate students tend to have higher family incomes than resident students. In 2021, 45% of nonresident undergraduates had family incomes of above $185,000. The same was true for 25% of undergraduates from California. Nearly three-quarters of nonresident undergraduates came from households exceeding $93,000; for California-based undergrads, it was 45%.
Read Next
Still, nonresident students on average pay much more to attend a UC campus, even after all financial aid is factored into their costs. The net price — which includes tuition, housing and other related costs minus grants and scholarships — for resident undergraduates with household incomes above $180,000 was around $37,000 a year last fall. For nonresident undergraduates, the average net price was $67,000.
“I support it (the nonresident tuition increase). I’ll get pushback for that, but here we are,” said Josiah Beharry, a student regent who can cast a vote on the board.
UC officials said that compared to some other major public universities, UC’s nonresident undergraduates pay lower nonresident fees. For example, University of Michigan nonresident students paid $11,500 more than their nonresident UC peers in 2023-24. University of Virginia nonresident undergraduate paid $7,000 more. Even when adjusting for living costs, nonresident Californians are charged less for their education, UC officials said.
UC policy permits 20% of new nonresident tuition revenue to be reserved for financial aid for nonresident undergraduates.
$30 billion in planned construction
The $30 billion construction plan — and $50 billion in projects without a funding source — were spelled out in a new, 207-page report detailing construction plans that UC budget officials presented to the system’s regents yesterday.
“The University’s enrollment growth and continuing needs for renewal, modernization and seismic correction of existing facilities are the key drivers of capital investments,” the report said.
Cranes have been soaring above the system’s campus skylines for years.
Since 2011, the UC has added beds for 42,000 students, growing from nearly 75,000 beds. The increase means the system can house 40% of its students, up from 32% a decade ago.
And UC isn’t done as it’s on track to build dorm space for 14,000 new beds at all nine undergraduate-serving campuses through 2030 — at a cost of $6.9 billion. That’s nearly half-a-million-dollars per bed.
But while student housing projects can largely pay for themselves over time through the rents campuses charge, classroom buildings have fewer sources of cash beyond system bonds and state dollars — which the UC says are hardly enough to meet campus needs.
Take for example all the seismic repairs UC says it must undergo to extend the life of its buildings, with structures built in the 1950s and 1960s representing the largest chunk of UC’s gargantuan building footprint. UC has $16 billion in seismic retrofit needs but only identified funding for 16% of that, or $2.5 billion, last academic year.
“I support it (the nonresident tuition increase). I’ll get pushback for that, but here we are.”
Josiah Beharry, uc student regent
It’s not just finding money that’s a concern for UC. As buildings undergo remodeling, the classrooms, research and other activity core to the system’s mission has to continue. “The scope and complexity of planning required to minimize these disruptions can often necessitate the construction of temporary or replacement space,” the report read.
The scale of the need is vast. According to the UC, about 1,464 buildings require seismic upgrades across the system.
UC officials disclosed yesterday that the system is debuting a new plan in which campuses will reduce its backlog of structures that need seismic upgrades by 4% annually, with the structures most in need of an overhaul receiving priority.
And then there’s all the new construction UC needs. The system completed 139 projects at a cost of $1.4 billion last academic year — but has more than $20 billion in active construction plans for about 400 projects. More than half of those are for UC’s extensive medical care operation, in part to satisfy state rules on strengthening hospitals to better withstand earthquakes.
Through 2030, UC’s construction plans total $30 billion, with about $12 billion for its medical centers. Philanthropy helps pay for all those projects, but only a little. Just about $2 billion of the construction plan budget will come from gifts. About $300 million will come from state funds directly — a relatively tiny portion of the overall revenue picture for the system’s six-year building plan. Much of the projects will be paid for with external financing, such as bonds that the system sells to investors.
But that’s just projects with a funding source. UC Berkeley, for example, has more than $14 billion in construction needs but has identified the funding for just about $2.8 billion of that.
What is getting built at the system’s oldest campus? For starters, a new undergraduate academic building that’ll include 27 classrooms and a 400-seat auditorium with a rooftop terrace. All of that costs $137 million. It’s scheduled to open in the 2025-26 academic year.
College Enrollment Statistics [2024]: Total + by Demographic
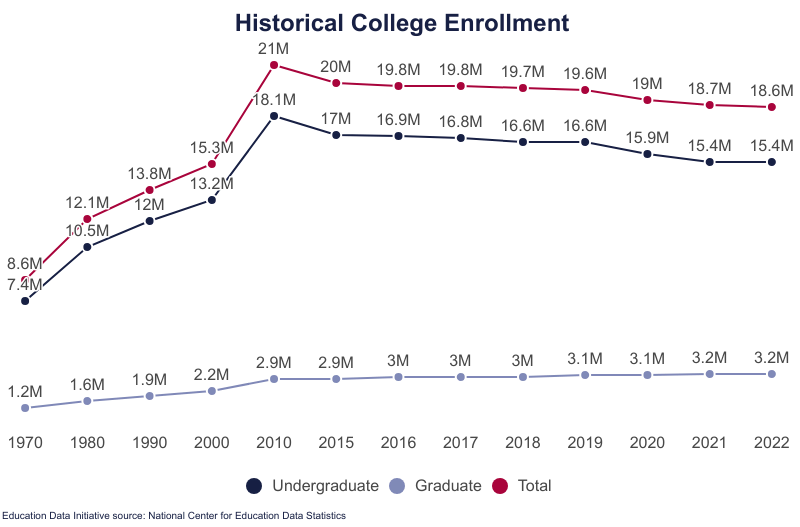
Report Highlights. College enrollment totaled 15.397 million undergraduate students nationwide in fall 2022, a 7% decline from 2019.
- The number of total enrolled postsecondary students declined by 0.4% from 2021 to 2022.
- 17.13% of all postsecondary students are in graduate programs.
- Preliminary data indicate that total postsecondary enrollment in Spring 2024 increased by 2.6% over the past year.
- 20.35% of the student population is Hispanic or Latino, a 483% increase from 1976.
- The number of female college attendance has nearly doubled since 1976, increasing by 82.9%.
A further 371,359 students attend postsecondary institutions that do not, at the time of publication, grant degrees; most of these institutions are transitioning to higher levels of education. Students at these institutions are excluded from this report unless noted otherwise. When including these students, the nationwide total number of postsecondary students climbs to 18.95 million as of Fall 2022.
Related research reports include Student Loan Debt Statistics | College Graduation Statistics | College Dropout Rates | Average Cost of College | Student Loan Refinancing
College Enrollment Statistics
College enrollment statistics indicate that more Americans are forgoing higher education; some may be putting off college attendance to build savings.
- Enrollment peaked in 2010 at 21.02 million.
- Since 2010, enrollment has declined 11.61%.
- 11.29 million or 60.7% of all students, graduate and undergraduate, are enrolled full-time.
- 62% of high school (or equivalent) graduates go on to postsecondary study.
- The rate of enrollment among new high school graduates declined 7.1% since 2018.
- Since 1960, the percentage of recent high school graduate enrollment increased by 16.9% in total.
- Among first-time, first-year college students, 82.68% are full-time students.
- As many as 5.52% of American adults are currently enrolled in college as part-time or full-time students.
- In the 2022-2023 academic year, 1,057,188 enrolled students were foreign-born.
| Year | Total Enrollment | % Public Institution Enrollment |
|---|---|---|
| 2024 (Projected) | 19,247,640 | 73.19% |
| 2023 (Projected) | 18,939,568 | 73.19% |
| 2022 | 18,580,026 | 72.63% |
| 2021 | 18,658,756 | 72.60% |
| 2020 | 19,027,410 | 72.97% |
| 2019 | 19,630,178 | 73.88% |
| 2018 | 19,651,412 | 73.99% |
| 2017 | 19,778,151 | 73.68% |
| 2016 | 19,846,904 | 73.49% |
| 2015 | 19,988,204 | 72.91% |
| 2014 | 20,209,092 | 72.52% |
| 2013 | 20,376,677 | 72.37% |
| 2012 | 20,644,478 | 72.10% |
| 2011 | 21,010,590 | 71.95% |
| 2010 | 21,019,438 | 72.04% |
| 2009 | 20,313,594 | 72.91% |
| 2008 | 19,081,686 | 73.22% |
| 2007 | 18,258,138 | 73.94% |
| 2006 | 17,754,230 | 74.21% |
| 2005 | 17,487,475 | 74.46% |
| 2004 | 17,272,044 | 75.15% |
| 2003 | 16,911,481 | 76.04% |
| 2002 | 16,611,711 | 76.77% |
| 2001 | 15,927,987 | 76.80% |
| 2000 | 15,312,289 | 76.75% |
| 1999 | 14,849,691 | 76.61% |
| 1998 | 14,506,967 | 76.78% |
| 1997 | 14,502,334 | 77.20% |
| 1996 | 14,367,520 | 77.40% |
| 1995 | 14,261,781 | 77.78% |
| 1994 | 14,278,790 | 77.97% |
| 1993 | 14,304,803 | 78.22% |
| 1992 | 14,487,359 | 78.58% |
| 1991 | 14,358,953 | 78.76% |
| 1990 | 13,818,637 | 78.48% |
| 1989 | 13,538,560 | 78.13% |
| 1988 | 13,055,337 | 77.83% |
| 1987 | 12,766,642 | 78.12% |
| 1986 | 12,503,511 | 77.69% |
| 1985 | 12,247,055 | 77.40% |
| 1984 | 12,241,940 | 77.42% |
| 1983 | 12,464,661 | 77.68% |
| 1982 | 12,425,780 | 78.03% |
| 1981 | 12,371,672 | 77.98% |
| 1980 | 12,096,895 | 78.18% |
| 1979 | 11,569,899 | 78.11% |
| 1978 | 11,260,092 | 78.03% |
| 1977 | 11,285,787 | 78.39% |
| 1976 | 11,012,137 | 78.58% |
| 1975 | 11,184,859 | 78.99% |
| 1974 | 10,223,729 | 78.14% |
| 1973 | 9,602,123 | 77.27% |
| 1972 | 9,214,860 | 76.73% |
| 1971 | 8,948,644 | 76.04% |
| 1970 | 8,580,887 | 74.91% |
| 1965 | 5,920,864 | 67.04% |
| 1961 | 4,145,065 | 61.80% |
| 1955 | 2,653,034 | 55.65% |
| 1950 | 2,281,298 | 49.96% |
College Enrollment by Degree
College enrollment statistics indicate that, whether they earn their degree or drop out, most undergraduate students make only one attempt to complete their college education.
- 72.63% of college students at all education levels attend public institutions.
- Among the 5.09 million undergraduates who attend private institutions, 80.77% attend nonprofit schools.
- 50.01% of graduate students attend public institutions.
- 61.21% of undergraduates are full-time or full-time equivalent (FTE) students.
- An estimated 4.21 million college students graduated in 2023.
- 24.06% received associate’s degrees.
- 50.2% received bachelor’s degrees.
- 20.93% earned master’s degrees.
- 4.8% earned doctorates or professional degrees.
- 52.18% of all bachelor’s degrees are in 5 fields.
- 18.63% in business
- 13.09% in health professions and related studies.
- 7.5% in social sciences and history.
- 6.52% in biological and biomedical sciences.
- 6.43% in psychology.
- 66.82% of associates’ degrees conferred are in 3 fields.
- 38.01% are in Liberal arts and sciences, general studies, and humanities.
- 17.06% in health professions and related.
- 11.21% in business.
College Enrollment by Institution Type
Most postsecondary students attend degree-granting 4-year public institutions.
- Among new high school graduates, 16.9% enroll in 2-year colleges; 45.1% enroll in 4-year programs.
- 13.92 million or 74.93% of all college students attend 4-year institutions.
- 4.66 million or 25.07% of all students attend 2-year institutions.
- 13.49 million or 72.63% of all postsecondary students attend public institutions.
- Among the 5.08 million or 27.25% of postsecondary students who attend private institutions, 80.77% attend nonprofit schools while 19.23% attend for-profit institutions.
| Year | % Public Institution Enrollment | % Full-Time Enrollment |
|---|---|---|
| Year 2024 (Projected) | % Public Institution Enrollment 73.20% | % Full-Time Enrollment 60.80% |
| Year 2023 (Projected) | % Public Institution Enrollment 73.20% | % Full-Time Enrollment 60.80% |
| Year 2022 | % Public Institution Enrollment 72.60% | % Full-Time Enrollment 60.70% |
| Year 2021 | % Public Institution Enrollment 72.60% | % Full-Time Enrollment 60.70% |
| Year 2020 | % Public Institution Enrollment 73.00% | % Full-Time Enrollment 61.00% |
| Year 2019 | % Public Institution Enrollment 73.90% | % Full-Time Enrollment 60.90% |
| Year 2018 | % Public Institution Enrollment 74.00% | % Full-Time Enrollment 61.00% |
| Year 2017 | % Public Institution Enrollment 73.70% | % Full-Time Enrollment 61.10% |
| Year 2016 | % Public Institution Enrollment 73.50% | % Full-Time Enrollment 61.10% |
| Year 2015 | % Public Institution Enrollment 72.90% | % Full-Time Enrollment 61.50% |
| Year 2014 | % Public Institution Enrollment 72.50% | % Full-Time Enrollment 61.60% |
| Year 2013 | % Public Institution Enrollment 72.40% | % Full-Time Enrollment 61.80% |
| Year 2012 | % Public Institution Enrollment 72.10% | % Full-Time Enrollment 61.70% |
| Year 2011 | % Public Institution Enrollment 71.90% | % Full-Time Enrollment 61.90% |
| Year 2010 | % Public Institution Enrollment 72.00% | % Full-Time Enrollment 62.30% |
| Year 2005 | % Public Institution Enrollment 74.50% | % Full-Time Enrollment 61.70% |
| Year 2000 | % Public Institution Enrollment 76.80% | % Full-Time Enrollment 58.80% |
| Year 1995 | % Public Institution Enrollment 77.80% | % Full-Time Enrollment 57.00% |
| Year 1990 | % Public Institution Enrollment 78.50% | % Full-Time Enrollment 56.60% |
| Year 1985 | % Public Institution Enrollment 77.40% | % Full-Time Enrollment 57.80% |
| Year 1980 | % Public Institution Enrollment 78.20% | % Full-Time Enrollment 58.70% |
| Year 1975 | % Public Institution Enrollment 79.00% | % Full-Time Enrollment 61.20% |
| Year 1970 | % Public Institution Enrollment 74.90% | % Full-Time Enrollment 67.80% |
| Year 1965 | % Public Institution Enrollment 67.00% | % Full-Time Enrollment 69.20% |
| Year 1959 | % Public Institution Enrollment 59.90% | % Full-Time Enrollment 66.50% |
College Enrollment by Race or Ethnicity
Demographic statistics are imperfect because many people do not fit easily into just one category. Not all races are represented, and some data, especially when it is historical, use obsolete definitions and terminology. The language of this report conforms to the language used in available data sets.
- 52.3% of college students are White or Caucasian; excluding nonresident noncitizens or international students.
- 55.5% of White or Caucasian students enroll at 4-year institutions.
- As a percentage of total student enrollments, the rate of enrollment of students of color has increased from 15.36% in 1976 to 45.23% in 2022, an absolute increase of 29.87%.
- Black and African American student enrolment has seen an absolute increase of 3.5% since 1976 relative to total enrollment.
- 21.18% of postsecondary students were white males in Fall 2022.
- 18.03% of graduate students were white males in Fall 202.
- Enrollment among Hispanic females has seen an absolute increase of 10.61% from 1976 to 2022 relative to total enrollment.
- American Indians and Alaska Natives had a low absolute increase of enrollment relative to total enrollments, increasing by 0.043% since 1976.
- The absolute increase in enrollment of American Indian and Alaska Native students in graduate programs is similarly low, increasing by 0.012% since 1976.

American Indian or Alaska Native Enrollment
Postsecondary attendance among American Indian or Alaska Native students was in decline between 2012 and 2021.
- 0.65% of students identify as American Indian or Alaska Native.
- Attendance among students of this demographic has increased 56.1% relative to 1976.
- American Indian or Alaska Native students saw their highest rate of attendance in 2007 (1.08%).
- 77.37% of students in this demographic attend public institutions.
- 64.74% of American Indian or Alaska Native students attend 4-year institutions.
Asian or Asian American Enrollment
Postsecondary attendance among Asian or Asian American students has steadily grown since 2010; attendance rates prior to 2010 combine Asian and Pacific Islander student populations.
- 7.38% of students identify as Asian or Asian American.
- Attendance among students of this demographic has increased 12.6% relative to 2010.
- 74.3% of Asians or Asian American attend public institutions.
- 78.77% of Asian or Asian American students attend 4-year institutions.
Black or African-American Enrollment
Postsecondary attendance among Black or African American students was on the rise until 2010; since then, it has been in decline.
- 12.5% of students identify as Black or African American.
- Attendance among students of this demographic has increased by 124.9% relative to 1976.
- 67.58% of students in this demographic attend public institutions.
- 71.88% of Black or African American students attend 4-year institutions.
Hispanic or Latino Enrollment
Postsecondary attendance among Hispanic or Latino students has skyrocketed in the last 50 years and continues to grow annually.
- 20.34% of the college student population identifies as Hispanic or Latino.
- Attendance among this demographic has increased by 884% relative to 1976.
- 80.4% of students in this demographic attend public institutions.
- 66.1% of Hispanic or Latino students enroll in 4-year colleges.
Pacific Islander Enrollment
As with the Asian or Asian American category, attendance rates prior to 2010 combined Asian and Pacific Islander student populations.
- 0.24% of the college student population identifies as Pacific Islander.
- Attendance among this demographic has declined by 30.6% relative to 2010.
- 62.8% of students in this demographic attend public institutions.
- 70.3% of Pacific Islander students enrolled in 4-year colleges.
Multiracial Enrollment
Students who identify as two or more races are categorized as multiracial. Data prior to 2010 is unavailable.
- 4.12% of the college student population identifies as multiracial.
- Attendance among multiracial students has increased by 135% relative to 2010.
- 74.3% of students in this demographic attend public institutions.
- 74.8% of multiracial students enroll in 4-year colleges.
| Year | % Racial or Ethnic Minority Enrollment | % Black or African American Enrollment |
|---|---|---|
| Year 2022 | % Racial or Ethnic Minority Enrollment 45.23% | % Black or African American Enrollment 12.50% |
| Year 2021 | % Racial or Ethnic Minority Enrollment 44.35% | % Black or African American Enrollment 12.48% |
| Year 2020 | % Racial or Ethnic Minority Enrollment 43.94% | % Black or African American Enrollment 12.54% |
| Year 2019 | % Racial or Ethnic Minority Enrollment 43.41% | % Black or African American Enrollment 12.57% |
| Year 2018 | % Racial or Ethnic Minority Enrollment 42.52% | % Black or African American Enrollment 12.70% |
| Year 2017 | % Racial or Ethnic Minority Enrollment 41.77% | % Black or African American Enrollment 12.89% |
| Year 2016 | % Racial or Ethnic Minority Enrollment 40.97% | % Black or African American Enrollment 13.05% |
| Year 2015 | % Racial or Ethnic Minority Enrollment 40.36% | % Black or African American Enrollment 13.41% |
| Year 2014 | % Racial or Ethnic Minority Enrollment 39.84% | % Black or African American Enrollment 13.82% |
| Year 2010 | % Racial or Ethnic Minority Enrollment 36.11% | % Black or African American Enrollment 14.46% |
| Year 2000 | % Racial or Ethnic Minority Enrollment 28.22% | % Black or African American Enrollment 11.30% |
| Year 1990 | % Racial or Ethnic Minority Enrollment 19.57% | % Black or African American Enrollment 9.02% |
| Year 1980 | % Racial or Ethnic Minority Enrollment 16.11% | % Black or African American Enrollment 9.15% |
| Year 1976 | % Racial or Ethnic Minority Enrollment 15.35% | % Black or African American Enrollment 9.38% |
US Nonresident Enrollment
The phrase US nonresident is defined as “A person who is not a citizen or national of the United States and who is in the United States on a visa or temporary basis and does not have the right to remain indefinitely”.
- 5.2% of enrolled college students are nonresident non-citizens.
- The attendance rate among these students increased 9.3% YoY.
- Attendance among these students has increased by 342.6% relative to 1976.
- Since 2010, attendance is up 36.8%.
- 58.4% of students in this demographic attend public institutions.
- 94.2% of nonresident, non-citizen students enroll in 4-year colleges.
| Year | % Female Enrollment | % Female Racial or Ethnic Minority Enrollment |
|---|---|---|
| Year 2022 | % Female Enrollment 57.94% | % Female Racial or Ethnic Minority Enrollment 27.19% |
| Year 2021 | % Female Enrollment 58.37% | % Female Racial or Ethnic Minority Enrollment 26.91% |
| Year 2020 | % Female Enrollment 58.56% | % Female Racial or Ethnic Minority Enrollment 26.80% |
| Year 2019 | % Female Enrollment 57.39% | % Female Racial or Ethnic Minority Enrollment 25.89% |
| Year 2018 | % Female Enrollment 57.03% | % Female Racial or Ethnic Minority Enrollment 25.21% |
| Year 2017 | % Female Enrollment 56.66% | % Female Racial or Ethnic Minority Enrollment 24.64% |
| Year 2016 | % Female Enrollment 56.47% | % Female Racial or Ethnic Minority Enrollment 24.11% |
| Year 2015 | % Female Enrollment 56.36% | % Female Racial or Ethnic Minority Enrollment 23.71% |
| Year 2014 | % Female Enrollment 56.47% | % Female Racial or Ethnic Minority Enrollment 23.45% |
| Year 2010 | % Female Enrollment 56.96% | % Female Racial or Ethnic Minority Enrollment 21.55% |
| Year 2000 | % Female Enrollment 56.10% | % Female Racial or Ethnic Minority Enrollment 16.53% |
| Year 1990 | % Female Enrollment 54.28% | % Female Racial or Ethnic Minority Enrollment 11.06% |
| Year 1980 | % Female Enrollment 51.44% | % Female Racial or Ethnic Minority Enrollment 8.80% |
| Year 1976 | % Female Enrollment 47.23% | % Female Racial or Ethnic Minority Enrollment 7.85% |
College Enrollment by Sex or Gender
Limited data makes no significant representation of genders beyond the standard binary. Updates to data collection policies may make these statistics available in the future.
- 64.8% of American women aged 25 years and older have pursued higher education.
- 50.24% of women 25 and older have at least one degree.
- 60.51% of men aged 25 years and older have pursued higher education.
- 45.89% of men 25 and older have at least one degree.
- Women over the age of 25 are 20.15% more likely to enroll in higher education than men and 19.1% more likely to earn a degree.
- 74.3% of male college students attend public institutions; 25.7% attend private schools.
- 71.4% of female students attend public institutions; 28.6% attend private schools.
- Women are 525% more likely to attend public institutions.
- 42.7% of undergraduate students are male.
- 40% of graduate students are men.
- In 1970, 41.2% of college students were women.
- 34.2% of American males aged 18 to 24 years are enrolled in college or graduate school.
- 43.8% of American females aged 18 to 24 years are enrolled in college or graduate school.
- Among first-time, full-time bachelor’s degree-seekers, females are 32.3% more likely to complete their degree at the first institution they enrolled in and within six (6) years compared to men.
- 58.5% of bachelor’s degrees are conferred to females.
- 62.6% of associate degrees and 62.8% of master’s degrees are conferred to women, respectively.
- 57% of doctorate degrees conferred belong to women.

College Enrollment by Age
Most college students first enroll in their late teens as full-time students. Part-time students are more likely to be older.
- Among Americans aged 25 years and older, 37.7% have a bachelor’s degree or higher.
- 67.2% of college students are projected to be aged 24 years and under in 2024.
- 39% of American 18- to 24-year-olds are enrolled in college or graduate school.
- 74.5% of all 18- and 19-year-olds are enrolled in schools of any type.
- 30.0% of 20- to 24-year-olds are enrolled in school.
- 6.95% of Americans aged 25 to 29 years are enrolled.
- 4.19% of 30- to 34-year-olds are enrolled in postsecondary education.
- 2.83% of 35- to 39-year-olds are enrolled.
- 1.69% of 40- to 49-year-olds are enrolled.
- Among people aged 50 to 64, 0.54% are enrolled.
- 0.10% of people aged 65 years and older are enrolled in postsecondary education.
- Students enrolled in Fall 2022 were 10.5% more likely to be between the ages of 18 and 24 than students enrolled in Fall 2005.
- Among all postsecondary students, the rate of 30- to 64-year-old enrollees declined by 29.6% between 2005 and 2022.

Percentage of High School Graduates That Go to College
The percentage of high school graduates (referred to sometimes as completers) who enroll in either 2-year or 4-year institutions following graduation is referred to as the “immediate college enrollment rate”.
- In Spring 2022, 2.99 million students graduated from high school, a 7% decline relative to the Class of 2018 (the largest graduating class).
- 62% of the Class of 2022 enrolled in postsecondary institutions in Fall 2023.
- Among the Class of 2022, 16.9% enrolled in 2-year institutions in Fall 2023.
- 45.1% of the Class of 2022 enrolled in 4-year institutions.
- Among males who graduated high school in 2022, 57.2% immediately enrolled in college.
- Females in the Class of 2022 had a 66% immediate matriculation rate.
- Among the Class of 2022, female students were 94.1% more likely to immediately matriculate.
- 2022 female high school graduates were 65% more likely to immediately enroll in 4-year institutions compared to graduating males.
- Among immediately college-bound members of the Class of 2021, female students were 86.4% more likely to attend 4-year institutions compared to males.

State College Enrollment Statistics
College enrollment statistics indicate that many students are willing to travel out of their home state for their college education.
- California has the highest number of enrolled college students at 2.487 million, a 97.8% increase relative to 1970.
- New York and Texas are the only other states with more than a million college students enrolled.
- Alaska has the smallest student population with 22,152 students enrolled; that’s a 112.7% increase relative to 1970.
- Wyoming, Montana, and Vermont all have fewer than 50,000 enrolled college students.
- New Hampshire, Utah, and Idaho have seen the largest increases in enrollment rates relative to 2010 at 184.01%, 56.94%, and 47% respectively.
- 45 states have seen a decline in postsecondary enrollment since 2010.
- Iowa and Alaska saw the largest declines in enrollment since 2010, losing 47% and 42.1% of their respective student populations
- The only jurisdictions to see an increase in the number of students enrolled since 2010 are New Hampshire, Utah, Idaho, Delaware, and Texas, as well as the District of Columbia.
- New Hampshire and Utah had the largest YoY student population growth at 8.1% and 2.87%, respectively.
| State | College Enrollment | % Change, 2010 to 2020 |
|---|---|---|
| State Alabama | College Enrollment 294,009 | % Change, 2010 to 2020 -10.30% |
| State Alaska | College Enrollment 20,152 | % Change, 2010 to 2020 -42.10% |
| State Arizona | College Enrollment 624,719 | % Change, 2010 to 2020 -21.30% |
| State Arkansas | College Enrollment 154,781 | % Change, 2010 to 2020 -12.00% |
| State California | College Enrollment 2,486,788 | % Change, 2010 to 2020 -8.40% |
| State Colorado | College Enrollment 346,716 | % Change, 2010 to 2020 -6.20% |
| State Connecticut | College Enrollment 187,764 | % Change, 2010 to 2020 -5.80% |
| State Delaware | College Enrollment 57,022 | % Change, 2010 to 2020 3.20% |
| State District of Columbia | College Enrollment 99,329 | % Change, 2010 to 2020 8.00% |
| State Florida | College Enrollment 999,223 | % Change, 2010 to 2020 -11.20% |
| State Georgia | College Enrollment 541,594 | % Change, 2010 to 2020 -4.80% |
| State Hawaii | College Enrollment 58,841 | % Change, 2010 to 2020 -24.60% |
| State Idaho | College Enrollment 125,249 | % Change, 2010 to 2020 47.00% |
| State Illinois | College Enrollment 677,446 | % Change, 2010 to 2020 -25.30% |
| State Indiana | College Enrollment 436,234 | % Change, 2010 to 2020 -5.10% |
| State Iowa | College Enrollment 202,287 | % Change, 2010 to 2020 -47.00% |
| State Kansas | College Enrollment 185,985 | % Change, 2010 to 2020 -13.40% |
| State Kentucky | College Enrollment 261,751 | % Change, 2010 to 2020 -10.10% |
| State Louisiana | College Enrollment 238,689 | % Change, 2010 to 2020 -9.50% |
| State Maine | College Enrollment 71,475 | % Change, 2010 to 2020 -1.30% |
| State Maryland | College Enrollment 329,092 | % Change, 2010 to 2020 -12.90% |
| State Massachusetts | College Enrollment 468,960 | % Change, 2010 to 2020 -7.60% |
| State Michigan | College Enrollment 466,458 | % Change, 2010 to 2020 -33.10% |
| State Minnesota | College Enrollment 373,128 | % Change, 2010 to 2020 -19.80% |
| State Mississippi | College Enrollment 155,950 | % Change, 2010 to 2020 -13.40% |
| State Missouri | College Enrollment 333,470 | % Change, 2010 to 2020 -25.00% |
| State Montana | College Enrollment 47,134 | % Change, 2010 to 2020 -11.50% |
| State Nebraska | College Enrollment 134,815 | % Change, 2010 to 2020 -6.80% |
| State Nevada | College Enrollment 113,588 | % Change, 2010 to 2020 -12.20% |
| State New Hampshire | College Enrollment 214,537 | % Change, 2010 to 2020 184.00% |
| State New Jersey | College Enrollment 378,819 | % Change, 2010 to 2020 -14.70% |
| State New Mexico | College Enrollment 110,082 | % Change, 2010 to 2020 -32.30% |
| State New York | College Enrollment 1,117,623 | % Change, 2010 to 2020 -14.40% |
| State North Carolina | College Enrollment 553,180 | % Change, 2010 to 2020 -5.60% |
| State North Dakota | College Enrollment 51,074 | % Change, 2010 to 2020 -10.20% |
| State Ohio | College Enrollment 612,352 | % Change, 2010 to 2020 -17.80% |
| State Oklahoma | College Enrollment 184,218 | % Change, 2010 to 2020 -20.10% |
| State Oregon | College Enrollment 194,987 | % Change, 2010 to 2020 -22.50% |
| State Pennsylvania | College Enrollment 633,991 | % Change, 2010 to 2020 -21.20% |
| State Rhode Island | College Enrollment 74,413 | % Change, 2010 to 2020 -12.60% |
| State South Carolina | College Enrollment 242,672 | % Change, 2010 to 2020 -5.60% |
| State South Dakota | College Enrollment 51,317 | % Change, 2010 to 2020 -12.10% |
| State Tennessee | College Enrollment 308,710 | % Change, 2010 to 2020 -12.20% |
| State Texas | College Enrollment 1,567,017 | % Change, 2010 to 2020 2.00% |
| State Utah | College Enrollment 401,218 | % Change, 2010 to 2020 56.90% |
| State Vermont | College Enrollment 39,888 | % Change, 2010 to 2020 -12.50% |
| State Virginia | College Enrollment 546,280 | % Change, 2010 to 2020 -5.50% |
| State Washington | College Enrollment 311,068 | % Change, 2010 to 2020 -19.90% |
| State West Virginia | College Enrollment 132,923 | % Change, 2010 to 2020 -12.80% |
| State Wisconsin | College Enrollment 316,129 | % Change, 2010 to 2020 -17.70% |
| State Wyoming | College Enrollment 29,971 | % Change, 2010 to 2020 -21.70% |
College Enrollment in Alabama
Among students enrolled full-time in Alabama postsecondary institutions, 68.3% are state residents and 31.7% are nonresidents.
- 294,009 students are enrolled in Alabama colleges.
- Enrollment in Alabama has declined by 10.8% since 2010.
- Between 1970 and 2010, enrollment in Alabama increased by 215.2%.
- 57.9% of full-time students in Alabama are female.
- 86.1% of students enrolled in Alabama postsecondary institutions attend public schools.
- Among all Alabama residents enrolled in college, 14.6% leave the state to attend school.
College Enrollment in Alaska
Among students enrolled full-time in Alaska postsecondary institutions, 86.7% are state residents and 13.3% are nonresidents.
- 20,152 students are enrolled in Alaska colleges.
- Enrollment in Alaska has declined 42.1% since 2010.
- Between 1970 and 2010, enrollment increased 267.4%.
- 57.2% of full-time students in Alaska are female.
- 95.1% of students enrolled in Alaska postsecondary institutions attend public schools.
- Among all Alaska residents enrolled in college, 51.3% leave the state to attend school.
College Enrollment in Arizona
Among students enrolled full-time in Arizona postsecondary institutions, 60.3% are state residents and 39.7% are nonresidents.
- 624,719 students are enrolled in Arizona colleges.
- Enrollment in Arizona has declined 21.3% since 2010.
- Between 1970 and 2010, enrollment increased 624.2%.
- 60.4% of full-time students in Arizona are female.
- 60.2% of students enrolled in Arizona postsecondary institutions attend public schools.
- Among all Arizona residents enrolled in college, 14.7% leave the state to attend school.
College Enrollment in Arkansas
Among students enrolled full-time in Arkansas postsecondary institutions, 68.3% are state residents and 31.7% are nonresidents.
- 154,781 students are enrolled in Arkansas colleges.
- Enrollment in Arkansas has declined by 12% since 2010.
- Between 1970 and 2010, enrollment increased 237.9%.
- 58.6% of full-time students in Arkansas are female.
- 89.5% of students enrolled in Arkansas postsecondary institutions attend public schools.
- Among all Arkansas residents enrolled in college, 17.3% leave the state to attend school.
College Enrollment in California
Among students enrolled full-time in California postsecondary institutions, 88.8% are state residents and 112% are nonresidents.
- 2,486,788 students are enrolled in California colleges.
- Enrollment in California has declined by 8.4% since 2010.
- Between 1970 and 2010, enrollment increased 115.9%.
- 57.3% of full-time students in California are female.
- 81.7% of students enrolled in California postsecondary institutions attend public schools.
- Among all California residents enrolled in college, 12.5% leave the state to attend school.
College Enrollment in Colorado
Among students enrolled full-time in Colorado postsecondary institutions, 66.3% are state residents and 33.7% are nonresidents.
- 346,716 students are enrolled in Colorado colleges.
- Enrollment in Colorado has declined by 6.2% since 2010.
- Between 1970 and 2010, enrollment increased by 199.4%.
- 56.1% of full-time students in Colorado are female.
- 77.6% of students enrolled in Colorado postsecondary institutions attend public schools.
- Among all Colorado residents enrolled in college, 31.8% leave the state to attend school.
College Enrollment in Connecticut
Among students enrolled full-time in Connecticut postsecondary institutions, 61.4% are state residents and 38.6% are nonresidents.
- 187,764 students are enrolled in Connecticut colleges.
- Enrollment in Connecticut has declined by 5.8% since 2010.
- Between 1970 and 2010, enrollment increased 59.9%.
- 57.2% of full-time students in Connecticut are female.
- 51.3% of students enrolled in Connecticut postsecondary institutions attend public schools.
- Among all Connecticut residents enrolled in college, 43.5% leave the state to attend school.
College Enrollment in Delaware
Among students enrolled full-time in Delaware postsecondary institutions, 50.5% are state residents and 49.5% are nonresidents.
- 57,022 students are enrolled in Delaware colleges.
- Enrollment in Delaware has increased by 3.2% since 2010.
- Between 1970 and 2010, enrollment increased by 118.8%.
- 59.4% of full-time students in Delaware are female.
- 72.9% of students enrolled in Delaware postsecondary institutions attend public schools.
- Among all Delaware residents enrolled in college, 27.1% leave the state to attend school.
College Enrollment in the District of Columbia
Among students enrolled full-time in D.C. postsecondary institutions, 6.9% are D.C. residents and 93.1% are nonresidents.
- 99,329 students are enrolled in D.C. colleges.
- Enrollment in D.C. has increased by 8% since 2010.
- Between 1970 and 2010, enrollment increased 19.2%.
- 62.1% of full-time students in D.C. are female.
- 3.6% of students enrolled in D.C. postsecondary institutions attend public schools.
- Among all D.C. residents enrolled in college, 78.1% leave the state to attend school.
College Enrollment in Florida
Among students enrolled full-time in Florida postsecondary institutions, 79.4% are state residents and 20.6% are nonresidents.
- 999,223 students are enrolled in Florida colleges.
- Enrollment in Florida has declined by 11.2% since 2010.
- Between 1970 and 2010, enrollment increased 377.6%.
- 57.3% of full-time students in Florida are female.
- 73.6% of students enrolled in Florida postsecondary institutions attend public schools.
- Among all Florida residents enrolled in college, 15.2% leave the state to attend school.
College Enrollment in Georgia
Among students enrolled full-time in Georgia postsecondary institutions, 79.9% are state residents and 20.1% are nonresidents.
- 541,594 students are enrolled in Georgia colleges.
- Enrollment in Georgia has declined by 4.8% since 2010.
- Between 1970 and 2010, enrollment increased 349.7%.
- 59% of full-time students in Georgia are female.
- 80.5% of students enrolled in Georgia postsecondary institutions attend public schools.
- Among all Georgia residents enrolled in college, 23.8% leave the state to attend school.
College Enrollment in Hawaii
Among students enrolled full-time in Hawaii postsecondary institutions, 66.7% are state residents and 33.3% are nonresidents.
- 58,841 students are enrolled in Hawaii colleges.
- Enrollment in Hawaii has declined by 24.6% since 2010.
- Between 1970 and 2010, enrollment increased by 113.5%.
- 62.8% of full-time students in Hawaii are female.
- 82.2% of students enrolled in Hawaii postsecondary institutions attend public schools.
- Among all Hawaii residents enrolled in college, 42.4% leave the state to attend school.
College Enrollment in Idaho
Among students enrolled full-time in Idaho postsecondary institutions, 60.3% are state residents and 39.7% are nonresidents.
- 125,249 students are enrolled in Idaho colleges.
- Enrollment in Idaho has increased 47% since 2010.
- Between 1970 and 2010, enrollment increased 146.5%.
- 55.4% of full-time students in Idaho are female.
- 62.5% of students enrolled in Idaho postsecondary institutions attend public schools.
- Among all Idaho residents enrolled in college, 28.7% leave the state to attend school.
College Enrollment in Illinois
Among students enrolled full-time in Illinois postsecondary institutions, 79.9% are state residents and 20.1% are nonresidents.
- 677,446 students are enrolled in Illinois colleges.
- Enrollment in Illinois has declined 25.4% since 2010.
- Between 1970 and 2010, enrollment increased by 100.6%.
- 55.6% of full-time students in Illinois are female.
- 61.6% of students enrolled in Illinois postsecondary institutions attend public schools.
- Among all Illinois residents enrolled in college, 32.9% leave the state to attend school.
College Enrollment in Indiana
Among students enrolled full-time in Indiana postsecondary institutions, 67.2% are state residents and 32.8% are nonresidents.
- 436,234 students are enrolled in Indiana colleges.
- Enrollment in Indiana has declined by 5.1% since 2010.
- Between 1970 and 2010, enrollment increased 138.5%.
- 54.6% of full-time students in Indiana are female.
- 80.0% of students enrolled in Indiana postsecondary institutions attend public schools.
- Among all Indiana residents enrolled in college, 16.3% leave the state to attend school.
College Enrollment in Iowa
Among students enrolled full-time in Iowa postsecondary institutions, 64.3% are state residents and 35.7% are nonresidents.
- 202,287 students are enrolled in Iowa colleges.
- Enrollment in Iowa has declined 47% since 2010.
- Between 1970 and 2010, enrollment increased 250.7%.
- 52% of full-time students in Iowa are female.
- 74.6% of students enrolled in Iowa postsecondary institutions attend public schools.
- Among all Iowa residents enrolled in college, 15.2% leave the state to attend school.
College Enrollment in Kansas
Among students enrolled full-time in Kansas postsecondary institutions, 69.4% are state residents and 30.6% are nonresidents.
- 185,985 students are enrolled in Kansas colleges.
- Enrollment in Kansas has declined by 13.4% since 2010.
- Between 1970 and 2010, enrollment increased 109.6%.
- 53% of full-time students in Kansas are female.
- 87.7% of students enrolled in Kansas postsecondary institutions attend public schools.
- Among all Kansas residents enrolled in college, 19.4% leave the state to attend school.
College Enrollment in Kentucky
Among students enrolled full-time in Kentucky postsecondary institutions, 77% are state residents and 23% are nonresidents.
- 261,751 students are enrolled in Kentucky colleges.
- Enrollment in Kentucky has declined by 10.1% since 2010.
- Between 1970 and 2010, enrollment increased 195.3%.
- 59.7% of full-time students in Kentucky are female.
- 74.2% of students enrolled in Kentucky postsecondary institutions attend public schools.
- Among all Kentucky residents enrolled in college, 16.7% leave the state to attend school.
College Enrollment in Louisiana
Among students enrolled full-time in Louisiana postsecondary institutions, 79.1% are state residents and 20.9% are nonresidents.
- 238,689 students are enrolled in Louisiana colleges.
- Enrollment in Louisiana has declined 9.5% since 2010.
- Between 1970 and 2010, enrollment increased 118.4%.
- 60.6% of full-time students in Louisiana are female.
- 86.8% of students enrolled in Louisiana postsecondary institutions attend public schools.
- Among all Louisiana residents enrolled in college, 15.9% leave the state to attend school.
College Enrollment in Maine
Among students enrolled full-time in Maine postsecondary institutions, 61.7% are state residents and 38.3% are nonresidents.
- 71,475 students are enrolled in Maine colleges.
- Enrollment in Maine has declined by 1.3% since 2010.
- Between 1970 and 2010, enrollment increased 112.1%.
- 57.9% of full-time students in Maine are female.
- 65.5% of students enrolled in Maine postsecondary institutions attend public schools.
- Among all Maine residents enrolled in college, 28.4% leave the state to attend school.
College Enrollment in Maryland
Among students enrolled full-time in Maryland postsecondary institutions, 77.3% are state residents and 22.7% are nonresidents.
- 329,092 students are enrolled in Maryland colleges.
- Enrollment in Maryland has declined by 12.9% since 2010.
- Between 1970 and 2010, enrollment increased 152.6%.
- 55.4% of full-time students in Maryland are female.
- 81.7% of students enrolled in Maryland postsecondary institutions attend public schools.
- Among all Maryland residents enrolled in college, 36.6% leave the state to attend school.
College Enrollment in Massachusetts
Among students enrolled full-time in Massachusetts postsecondary institutions, 55.7% are state residents and 44.3% are nonresidents.
- 468,960 students are enrolled in Massachusetts colleges.
- Enrollment in Massachusetts has declined by 7.6% since 2010.
- Between 1970 and 2010, enrollment increased 67.1%.
- 55.8% of full-time students in Massachusetts are female.
- 38.3% of students enrolled in Massachusetts postsecondary institutions attend public schools.
- Among all Massachusetts residents enrolled in college, 37.7% leave the state to attend school.
College Enrollment in Michigan
Among students enrolled full-time in Michigan postsecondary institutions, 83.5% are state residents and 16.5% are nonresidents.
- 466,458 students are enrolled in Michigan colleges.
- Enrollment in Michigan has declined 33.1% since 2010.
- Between 1970 and 2010, enrollment increased by 77.7%.
- 55% of full-time students in Michigan are female.
- 87.1% of students enrolled in Michigan postsecondary institutions attend public schools.
- Among all Michigan residents enrolled in college, 14% leave the state to attend school.
College Enrollment in Minnesota
Among students enrolled full-time in Minnesota postsecondary institutions, 77.9% are state residents and 22.1% are nonresidents.
- 373,128 students are enrolled in Minnesota colleges.
- Enrollment in Minnesota has declined by 19.8% since 2010.
- Between 1970 and 2010, enrollment increased 189.5%.
- 59.7% of full-time students in Minnesota are female.
- 59.8% of students enrolled in Minnesota postsecondary institutions attend public schools.
- Among all Minnesota residents enrolled in college, 34.7% leave the state to attend school.
College Enrollment in Mississippi
Among students enrolled full-time in Mississippi postsecondary institutions, 72.5% are state residents and 27.5% are nonresidents.
- 155,950 students are enrolled in Mississippi colleges.
- Enrollment in Mississippi has declined by 13.4% since 2010.
- Between 1970 and 2010, enrollment increased by 143.3%.
- 60.1% of full-time students in Mississippi are female.
- 89% of students enrolled in Mississippi postsecondary institutions attend public schools.
- Among all Mississippi residents enrolled in college, 13% leave the state to attend school.
College Enrollment in Missouri
Among students enrolled full-time in Missouri postsecondary institutions, 75% are state residents and 25% are nonresidents.
- 333,470 students are enrolled in Missouri colleges.
- Enrollment in Missouri has declined by 25.0% since 2010.
- Between 1970 and 2010, enrollment increased 141.8%.
- 56.2% of full-time students in Missouri are female.
- 63.1% of students enrolled in Missouri postsecondary institutions attend public schools.
- Among all Missouri residents enrolled in college, 23.9% leave the state to attend school.
College Enrollment in Montana
Among students enrolled full-time in Montana postsecondary institutions, 54.6% are state residents and 45.4% are nonresidents.
- 47,134 students are enrolled in Montana colleges.
- Enrollment in Montana has declined by 11.5% since 2010.
- Between 1970 and 2010, enrollment increased 77.2%.
- 53% of full-time students in Montana are female.
- 92.4% of students enrolled in Montana postsecondary institutions attend public schools.
- Among all Montana residents enrolled in college, 28.6% leave the state to attend school.
College Enrollment in Nebraska
Among students enrolled full-time in Nebraska postsecondary institutions, 74% are state residents and 26% are nonresidents.
- 134,815 students are enrolled in Nebraska colleges.
- Enrollment in Nebraska has declined by 6.8% since 2010.
- Between 1970 and 2010, enrollment increased 116.2%.
- 55.7% of full-time students in Nebraska are female.
- 72.8% of students enrolled in Nebraska postsecondary institutions attend public schools.
- Among all Nebraska residents enrolled in college, 24.9% leave the state to attend school.
College Enrollment in Nevada
Among students enrolled full-time in Nevada postsecondary institutions, 89.5% are state residents and 10.5% are nonresidents.
- 113,588 students are enrolled in Nevada colleges.
- Enrollment in Nevada has declined by 12.2% since 2010.
- Between 1970 and 2010, enrollment increased 846.4%.
- 59.4% of full-time students in Nevada are female.
- 91.7% of students enrolled in Nevada postsecondary institutions attend public schools.
- Among all Nevada residents enrolled in college, 26% leave the state to attend school.
College Enrollment in New Hampshire
Among students enrolled full-time in New Hampshire postsecondary institutions, 21.4% are state residents and 78.6% are nonresidents.
- 214,537 students are enrolled in New Hampshire colleges.
- Enrollment in New Hampshire has increased 184% since 2010.
- Between 1970 and 2010, enrollment increased 156.9%.
- 58.6% of full-time students in New Hampshire are female.
- 15.1% of students enrolled in New Hampshire postsecondary institutions attend public schools.
- Among all New Hampshire residents enrolled in college, 50.1% leave the state to attend school.
College Enrollment in New Jersey
Among students enrolled full-time in New Jersey postsecondary institutions, 88.7% are state residents and 11.3% are nonresidents.
- 378,819 students are enrolled in New Jersey colleges.
- Enrollment in New Jersey has declined 14.7% since 2010.
- Between 1970 and 2010, enrollment increased by 105.5%.
- 52.8% of full-time students in New Jersey are female.
- 77.9% of students enrolled in New Jersey postsecondary institutions attend public schools.
- Among all New Jersey residents enrolled in college, 39.2% leave the state to attend school.
College Enrollment in New Mexico
Among students enrolled full-time in New Mexico postsecondary institutions, 82.7% are state residents and 17.3% are nonresidents.
- 110,082 students are enrolled in New Mexico colleges.
- Enrollment in New Mexico has declined by 32.3% since 2010.
- Between 1970 and 2010, enrollment increased by 265.6%.
- 59.2% of full-time students in New Mexico are female.
- 96.4% of students enrolled in New Mexico postsecondary institutions attend public schools.
- Among all New Mexico residents enrolled in college, 18.7% leave the state to attend school.
College Enrollment in New York
Among students enrolled full-time in New York postsecondary institutions, 73.9% are state residents and 26.1% are nonresidents.
- 1,117,623 students are enrolled in New York colleges.
- Enrollment in New York has declined by 14.4% since 2010.
- Between 1970 and 2010, enrollment increased 61.8%.
- 56.4% of full-time students in New York are female.
- 52% of students enrolled in New York postsecondary institutions attend public schools.
- Among all New York residents enrolled in college, 22.9% leave the state to attend school.
College Enrollment in North Carolina
Among students enrolled full-time in North Carolina postsecondary institutions, 78.6% are state residents and 21.4% are nonresidents.
- 553,180 students are enrolled in North Carolina colleges.
- Enrollment in North Carolina has declined by 5.6% since 2010.
- Between 1970 and 2010, enrollment increased by 240.7%.
- 57.9% of full-time students in North Carolina are female.
- 82.3% of students enrolled in North Carolina postsecondary institutions attend public schools.
- Among all North Carolina residents enrolled in college, 15.7% leave the state to attend school.
College Enrollment in North Dakota
Among students enrolled full-time in North Dakota postsecondary institutions, 49.5% are state residents and 50.5% are nonresidents.
- 51,074 students are enrolled in North Dakota colleges.
- Enrollment in North Dakota has declined by 10.2% since 2010.
- Between 1970 and 2010, enrollment increased by 80.7%.
- 51.7% of full-time students in North Dakota are female.
- 86.7% of students enrolled in North Dakota postsecondary institutions attend public schools.
- Among all North Dakota residents enrolled in college, 26.7% leave the state to attend school.
College Enrollment in Ohio
Among students enrolled full-time in Ohio postsecondary institutions, 75.8% are state residents and 24.2% are nonresidents.
- 612,352 students are enrolled in Ohio colleges.
- Enrollment in Ohio has declined 17.8% since 2010.
- Between 1970 and 2010, enrollment increased by 98%.
- 55.4% of full-time students in Ohio are female.
- 77.2% of students enrolled in Ohio postsecondary institutions attend public schools.
- Among all Ohio residents enrolled in college, 17.4% leave the state to attend school.
College Enrollment in Oklahoma
Among students enrolled full-time in Oklahoma postsecondary institutions, 76% are state residents and 24% are nonresidents.
- 184,218 students are enrolled in Oklahoma colleges.
- Enrollment in Oklahoma has declined by 20.1% since 2010.
- Between 1970 and 2010, enrollment increased 109.3%.
- 56.4% of full-time students in Oklahoma are female.
- 86.6% of students enrolled in Oklahoma postsecondary institutions attend public schools.
- Among all Oklahoma residents enrolled in college, 17.2% leave the state to attend school.
College Enrollment in Oregon
Among students enrolled full-time in Oregon postsecondary institutions, 69.5% are state residents and 30.5% are nonresidents.
- 194,987 students are enrolled in Oregon colleges.
- Enrollment in Oregon has declined by 22.5% since 2010.
- Between 1970 and 2010, enrollment increased by 106%.
- 56.6% of full-time students in Oregon are female.
- 85.4% of students enrolled in Oregon postsecondary institutions attend public schools.
- Among all Oregon residents enrolled in college, 21.8% leave the state to attend school.
College Enrollment in Pennsylvania
Among students enrolled full-time in Pennsylvania postsecondary institutions, 67.1% are state residents and 32.9% are nonresidents.
- 633,991 students are enrolled in Pennsylvania colleges.
- Enrollment in Pennsylvania has declined by 21.2% since 2010.
- Between 1970 and 2010, enrollment increased by 95.8%.
- 55.4% of full-time students in Pennsylvania are female.
- 54.1% of students enrolled in Pennsylvania postsecondary institutions attend public schools.
- Among all Pennsylvania residents enrolled in college, 24% leave the state to attend school.
College Enrollment in Puerto Rico
Among students enrolled full-time in Pennsylvania postsecondary institutions, 67.1% are state residents and 32.9% are nonresidents.
- 633,991 students are enrolled in Pennsylvania colleges.
- Enrollment in Pennsylvania has declined by 21.2% since 2010.
- Between 1970 and 2010, enrollment increased by 95.8%.
- 55.4% of full-time students in Pennsylvania are female.
- 54.1% of students enrolled in Pennsylvania postsecondary institutions attend public schools.
- Among all Pennsylvania residents enrolled in college, 24% leave the state to attend school.
College Enrollment in Rhode Island
Among students enrolled full-time in Rhode Island postsecondary institutions, 39.7% are state residents and 60.3% are nonresidents.
- 74,413 students are enrolled in Rhode Island colleges.
- Enrollment in Rhode Island has declined by 12.6% since 2010.
- Between 1970 and 2010, enrollment increased 85.4%.
- 56.1% of full-time students in Rhode Island are female.
- 47.7% of students enrolled in Rhode Island postsecondary institutions attend public schools.
- Among all Rhode Island residents enrolled in college, 33.2% leave the state to attend school.
College Enrollment in South Carolina
Among students enrolled full-time in South Carolina postsecondary institutions, 70.9% are state residents and 29.1% are nonresidents.
- 242,672 students are enrolled in South Carolina colleges.
- Enrollment in South Carolina has declined by 5.6% since 2010.
- Between 1970 and 2010, enrollment increased 269.8%.
- 57.5% of full-time students in South Carolina are female.
- 83% of students enrolled in South Carolina postsecondary institutions attend public schools.
- Among all South Carolina residents enrolled in college, 16.6% leave the state to attend school.
College Enrollment in South Dakota
Among students enrolled full-time in South Dakota postsecondary institutions, 58.3% are state residents and 41.7% are nonresidents.
- 51,317 students are enrolled in South Dakota colleges.
- Enrollment in South Dakota has declined by 12.1% since 2010.
- Between 1970 and 2010, enrollment increased by 90.5%.
- 52% of full-time students in South Dakota are female.
- 83.3% of students enrolled in South Dakota postsecondary institutions attend public schools.
- Among all South Dakota residents enrolled in college, 26.4% leave the state to attend school.
College Enrollment in Tennessee
Among students enrolled full-time in Tennessee postsecondary institutions, 71% are state residents and 29% are nonresidents.
- 308,710 students are enrolled in Tennessee colleges.
- Enrollment in Tennessee has declined by 12.2% since 2010.
- Between 1970 and 2010, enrollment increased 160.4%.
- 59.1% of full-time students in Tennessee are female.
- 68% of students enrolled in Tennessee postsecondary institutions attend public schools.
- Among all Tennessee residents enrolled in college, 20.7% leave the state to attend school.
College Enrollment in Texas
Among students enrolled full-time in Texas postsecondary institutions, 91.9% are state residents and 8.1% are nonresidents.
- 1,567,017 students are enrolled in Texas colleges.
- Enrollment in Texas has increased by 2% since 2010.
- Between 1970 and 2010, enrollment increased 247.3%.
- 56.7% of full-time students in Texas are female.
- 88.4% of students enrolled in Texas postsecondary institutions attend public schools.
- Among all Texas residents enrolled in college, 14.7% leave the state to attend school.
College Enrollment in Utah
Among students enrolled full-time in Utah postsecondary institutions, 63.1% are state residents and 36.9% are nonresidents.
- 401,218 students are enrolled in Utah colleges.
- Enrollment in Utah has increased by 56.9% since 2010.
- Between 1970 and 2010, enrollment increased by 213%.
- 59% of full-time students in Utah are female.
- 48.6% of students enrolled in Utah postsecondary institutions attend public schools.
- Among all Utah residents enrolled in college, 11.4% leave the state to attend school.
College Enrollment in Vermont
Among students enrolled full-time in Vermont postsecondary institutions, 25.5% are state residents and 74.5% are nonresidents.
- 39,888 students are enrolled in Vermont colleges.
- Enrollment in Vermont has declined by 12.5% since 2010.
- Between 1970 and 2010, enrollment increased by 105.2%.
- 52.6% of full-time students in Vermont are female.
- 63.3% of students enrolled in Vermont postsecondary institutions attend public schools.
- Among all Vermont residents enrolled in college, 54.6% leave the state to attend school.
College Enrollment in Virginia
Among students enrolled full-time in Virginia postsecondary institutions, 75.1% are state residents and 24.9% are nonresidents.
- 546,280 students are enrolled in Virginia colleges.
- Enrollment in Virginia has declined by 5.5% since 2010.
- Between 1970 and 2010, enrollment increased 280.4%.
- 56.6% of full-time students in Virginia are female.
- 67.8% of students enrolled in Virginia postsecondary institutions attend public schools.
- Among all Virginia residents enrolled in college, 21.4% leave the state to attend school.
College Enrollment in Washington
Among students enrolled full-time in Washington postsecondary institutions, 83% are state residents and 17% are nonresidents.
- 311,068 students are enrolled in Washington colleges.
- Enrollment in Washington has declined 19.9% since 2010.
- Between 1970 and 2010, enrollment increased 111.5%.
- 57.3% of full-time students in Washington are female.
- 86.0% of students enrolled in Washington postsecondary institutions attend public schools.
- Among all Washington residents enrolled in college, 25.8% leave the state to attend school.
College Enrollment in West Virginia
Among students enrolled full-time in West Virginia postsecondary institutions, 56.2% are state residents and 43.8% are nonresidents.
- 132,923 students are enrolled in West Virginia colleges.
- Enrollment in West Virginia has declined by 12.8% since 2010.
- Between 1970 and 2010, enrollment increased 141.4%.
- 56.5% of full-time students in West Virginia are female.
- 53.7% of students enrolled in West Virginia postsecondary institutions attend public schools.
- Among all West Virginia residents enrolled in college, 17.5% leave the state to attend school.
College Enrollment in Wisconsin
Among students enrolled full-time in Wisconsin postsecondary institutions, 71.9% are state residents and 28.1% are nonresidents.
- 316,129 students are enrolled in Wisconsin colleges.
- Enrollment in Wisconsin has declined by 17.7% since 2010.
- Between 1970 and 2010, enrollment increased by 90.1%.
- 56% of full-time students in Wisconsin are female.
- 82.7% of students enrolled in Wisconsin postsecondary institutions attend public schools.
- Among all Wisconsin residents enrolled in college, 21% leave the state to attend school.
College Enrollment in Wyoming
Among students enrolled full-time in Wyoming postsecondary institutions, 63.8% are state residents and 36.2% are nonresidents.
- 29,971 students are enrolled in Wyoming colleges.
- Enrollment in Wyoming has declined by 21.7% since 2010.
- Between 1970 and 2010, enrollment increased by 151.6%.
- 52.4% of full-time students in Wyoming are female.
- 96.7% of students enrolled in Wyoming postsecondary institutions attend public schools.
- Among all Wyoming residents enrolled in college, 26.9% leave the state to attend school.

International Student Population & Enrollment Statistics
International enrollment for 2021 declined significantly due to COVID-related travel restrictions.
- In the 2020-2021 academic year, 1,057,188 international students enrolled in U.S. postsecondary institutions.
- 70.77% of international students studying in U.S. postsecondary institutions were from Asia.
- Among Asian international students, 38.7% were from China and 35.9% were from India.
- Relative to 1980, enrollment numbers among Asian international students increased by 690.5%.
- 4.95% of international students were from the Middle East or North Africa.
- International students from more than 30 countries studied in the U.S. in 2022-2023.
- 8.5% of international students were from Europe.
- 7.8% of international students were from Latin America.
- 5% of international students came from Southeast Asia (including Indonesia).
- 4.7% of international students were Sub-Saharan African.
- 2.6% of international students were Canadian.
- 0.43% of international students were Australian.
Study Abroad Enrollment Statistics
Nearly 350,000 students studied abroad in the 2018-2019 academic year; students are most likely to study abroad over a summer, and women are more than twice as likely to study abroad compared to men.
- In 2019-2020, 162,633 U.S. college students studied overseas, 67.4% of them were women.
- 42.7% of study-abroad students travel overseas during their junior year.
- 38.6% of study abroad students travel during a summer term.
- 30.7% of study abroad students study overseas for one (1) semester.
- 19.3% of study abroad students stay for a term of eight (8) weeks or less; 0.2% remain for a full calendar year.
- 55.7% of all study abroad students travel to Europe.
- American students are more than 58% more likely to study in Europe as they are in any other host region.
- 13.8% of study-abroad students travel to Latin America; 11.7% travel to Asia.
- In 10 years, the number of students studying abroad decreased 33.%.
- 68.7% of study abroad students identify as white.
- 10.9% of study abroad students identify as Hispanic; 8.9% (#2) identify as Asian or Pacific Islander.
- 0.6% of study abroad students remain in North America (i.e. Canada).
Sources
The Future of Higher Education Enrollment in California
Key Takeaways
Higher education has long been a driver of economic mobility and well-being in California. In recent years, declines in the number of young adults led to falling enrollment at many colleges and universities across the country, but not at most of California’s higher education institutions. During the pandemic, however, the state population dropped and higher education enrollment declined. How will California’s colleges and universities fare in the future? In this report, we extrapolate from current trends in order to project undergraduate enrollment in California over the next two decades. We find that:
- Enrollment in higher education will increase slightly over the next decade. Declines in the number of young adults of prime college-going ages will be offset by rising rates of college-going. We expect college-going rates to resume the upward trajectory that we observed prior to the pandemic. This will help mitigate the effect of demographic changes. →
- To a large extent, increases in college participation will be driven by increases in the share of high school graduates who complete the college prep courses (the A–G requirement) required to be considered for admission at the University of California (UC) and California State University (CSU).
- Community colleges are likely to face bigger enrollment challenges than the state’s four-year colleges and universities. Our projections suggest that community colleges will see little growth in enrollment after recovering from pandemic losses. UC is projected to have robust growth, while CSU and private nonprofit colleges will see modest growth.
- Increases in college participation among Latinos will help narrow racial/ethnic gaps in college enrollment and completion. By 2035, Latinos will make up about half of students at CSU and the community colleges. Asian students will remain the largest group at UC, and white students will remain the largest group at private nonprofit colleges.
- California has a long track record of public investment in higher education that has allowed for large enrollment increases. Bonds to pay for infrastructure, whether it is online capacity or brick and mortar classrooms, will be necessary to realize the projected enrollment increases. The last state bond to fund higher education infrastructure was passed in 2006. →
- These increases in enrollment will help the state reach its goal of 40 percent of working-age adults with bachelor’s degrees by 2035. However, this goal is reachable largely because a substantial share of people who moved to California have bachelor’s degrees (57% of 25- to 54-year-olds). In contrast, only 35 percent of California-born young adults have a bachelor’s degree. A focus on increasing college completion among young Californians would improve educational mobility—and help close equity gaps in the state’s higher education systems.
Introduction
California has long thought of itself as a leader in higher education. The state’s innovative Master Plan for Higher Education was established in 1960 with the aim of providing postsecondary opportunities for “anyone who could benefit.” The plan both anticipated and led to a tremendous increase in higher education enrollment and completion. New campuses were built and existing campuses were expanded. In 1960, 227,000 young adults (16% of all 18- to 24-year-olds) were either enrolled in college or had earned a degree; that number had almost quadrupled to 877,000 (27%) by 1980.(1)
The Master Plan was quite ambitious: at a time when only 11 percent of adults of prime working age (25 to 54) had bachelor’s degrees, the plan made the top eighth (or 12.5%) of high school graduates eligible for the University of California (UC) system, and the top third (33%) eligible for the California State University (CSU) system.(2) Additional spaces were to be reserved for students transferring from the state’s community colleges.
But by the beginning of this century, it was clear that California’s Master Plan was out of date. The share of adults of prime working age with at least a bachelor’s degree reached 37 percent in 2021. And even as a college degree became more common, its advantages grew. Today, workers with college degrees have near-record low levels of unemployment, enjoy wage premiums at or near record levels, and have jobs with more benefits than less-educated workers (Cuellar Mejia et al. 2023). The demand for college graduates remains stronger than ever.
As part of an ambitious “California Blueprint,” the state recently set a goal for degree attainment: by 2030, 70 percent of working age adults (ages 25 to 64) will have a postsecondary award (30%) or a bachelor’s degree (40%).(3) Achieving this goal will require increases in both college enrollment and persistence (graduation rates). According to the Lumina Foundation, 55 percent of working-age Californians currently have some sort of postsecondary credential (including a bachelor’s degree); 37 percent had at least a bachelor’s degree.
California’s higher education systems are pursuing this goal in a time of uncertainty. After decades of tremendous population growth, California faces an extended period of demographic stagnation. The pandemic accelerated domestic migration out of the state and slowed international migration to the state. Meanwhile, birth rates have continued their decades-long decline and are now at historic lows. That means fewer children in our K–12 system and fewer high school graduates. The California Department of Finance (DOF) projects that between 2022 and 2040 the state’s population will increase only 3 percent, and the number of 18- to 24-year-olds will decline 8 percent (with most of the losses occurring after 2035). This means that growth in college enrollment will depend on increases in college-going and persistence rates rather than increases in the number of Californians.
The good news is that California has seen increases in college-going and completion in recent years, especially at the state’s public universities: the UC and the CSU. Educators and policymakers want this trend to continue.
In this report, we project the future of higher education enrollment in California and calculate whether increases in enrollment will meet the state’s higher education goal. Our focus is on undergraduate enrollment at the state’s four major sectors of higher education: the California Community Colleges, the University of California, the California State University, and private nonprofit four-year colleges in California (See Technical Appendix A for details of our methods and data). A critical component of our analysis is a consideration of capacity plans at the state’s public colleges and universities.
It is important to note that these projections depend on a number of assumptions. We assume that pre-pandemic trends in college-going rates and persistence to graduation will resume, and that past increases in college preparation of high school graduates will continue. Most important, we assume that the state’s university systems will be able to grow to accommodate student demand. Finally, we assume that the underlying demographic forces that will shape the state’s future population are adequately captured by the California Department of Finance projections.
College Enrollment and Completion Have Long Trended Upward
Historically, California’s higher education system has experienced remarkable growth. In the last half of the 20th century, policies and investments helped the public colleges add campuses and students to match the state’s rapid population growth. California’s population growth slowed this century, but higher education enrollment and completion continued to increase as the share of high school graduates going to college grew. By 2021, the share of young California-born adults with at least a bachelor’s degree exceeded 35 percent, up from only about 20 percent in 1990 (Figure 1).
Figure 1
Californians are increasingly likely to earn a bachelor’s degree
Percent of California-born residents of the US with at least a bachelor's degree, 18–30 year-olds

SOURCE: Authors’ estimates based on decennial census and American Community Survey data, accessed via IPUMS based on California-born residents living anywhere in the US.
NOTES: It is not possible with existing data to calculate the historic share (back to 1990) of California K–12 students who go on to earn a bachelor’s degree. We use state of birth as a proxy measure of college completion rates among young adults who attended K–12 school in California. See Technical Appendix for more information.
It is likely that continued increases in college enrollment and completion will help California achieve its goal that 40 percent of working-age adults hold bachelor’s degrees by 2030.
However, one of the main reasons California is nearing this goal is that less-educated adults have been leaving the state in large numbers for decades, while more highly educated adults have been moving here from other states. Only 35 percent of California-born residents ages 25 to 54 have at least a bachelor’s degree, compared to 57 percent of residents who moved to California from another state (Figure 2).
Figure 2
California-born residents are less likely to hold college degrees than those born elsewhere
% of Californians age 25–54 with at least a bachelor's degree

SOURCE: Authors’ calculations based on ACS data accessed via IPUMS.
Indeed, young adults born in California are less likely to hold bachelor’s degrees than their counterparts in most other states (Figure 3). Eight other states currently have a mid- to late-20s baccalaureate completion rate of at least 45 percent. Massachusetts has the highest rate (56%), and New York—like California, a large and diverse state—has a rate of 47 percent.(4) This suggests that California’s 40 percent baccalaureate goal is too modest.
Figure 3
Californians in their late 20s are less likely to have bachelor’s degrees than their peers in most other states
Share of 25–29 year-olds with a bachelor's degree, by state of birth

SOURCE: Author calculations based on 2021 American Community Survey data accessed via IPUMS.
However, there is some reason for optimism. Californians have high educational aspirations: according to the PPIC Statewide Survey, 68 percent of parents hope their child will earn at least a bachelor’s degree. And college enrollment has been increasing in recent years (Baldassare et al. 2024).
Recent Enrollment Trends Have Varied across Education Segments
Over the past ten years, the number of high school graduates has changed very little—it has increased from 411,000 in 2010–11 to 418,000 in 2020–21. But the share of graduates who complete the college preparation courses required for admission to UC and CSU (known as the A–G requirement) has grown from just over a third (37%) to over half (52%). That translates into a sharp increase in the number of college-prepared students (Figure 4) and substantial increases in college enrollment. The number of undergraduates enrolled in California colleges peaked at 2.4 million in 2017, up from 1.6 million in 1995.
Figure 4
High school graduates are more likely to have completed UC and CSU college-preparatory courses

SOURCE: Author calculations based on CDE data.
NOTE: Completion of A–G courses is a requirement for admission to UC and CSU.
But over the past few years, California’s population has declined and college enrollment has fallen (Figure 5). This decline has been uneven across higher education segments. UC has had strong increases in enrollment and applications over the past 15 years. As the most selective system in the state, UC does not admit all eligible applicants at eight of its nine campuses; the ninth campus, UC Merced, accepts eligible students that are turned away from their preferred campus. In general, highly selective colleges across the nation have avoided the enrollment challenges facing less-selective colleges.
CSU’s enrollment trends have been mixed, with impacted campuses (those that cannot accommodate all qualified applicants) experiencing strong demand and enrollment growth, while other campuses are struggling to attract students.
Private nonprofit colleges largely follow the pattern of CSU: some are struggling, while others (mostly the highly selective schools) continue to see strong demand. The state’s community colleges have seen an unprecedented decline in enrollment that began before the pandemic.
Much like trends over the past decade or so, pandemic disruptions were not equally felt across student populations and systems.
Figure 5
The number of undergraduates in California has declined in recent years
Number of undergraduate students in California

SOURCE: Authors’ calculations based on IPEDS, system offices, and American Community Survey data accessed via IPUMS.
NOTE: Excludes special admit students in community colleges.
The California Community Colleges, the largest postsecondary system in the country, experienced unprecedented declines in enrollment (Figure 6). For policymakers looking to increase college enrollment and graduation rates, the large losses of students aged 50 and over are not as troubling as the drop in enrollment by younger students: while older students tend to take courses for vocational or enrichment purposes, most younger students aspire to transfer to a four-year college and earn a bachelor’s degree.(5)
Figure 6
Community college enrollment declines have been concentrated in younger and older age groups
Change in student enrollment at CCC from 2019–20 to 2020–21

SOURCE: Authors’ tabulations of CCCCO Data Mart tables.
NOTE: Student headcount for entire California community college system.
The state’s four-year public colleges have been less affected by the pandemic: there have been very slight declines in enrollment at private nonprofit colleges and CSU, and small increases at UC.
It is not clear how long the pandemic-induced disruptions might last. Our forecast assumes that pre-pandemic trends in college-going rates and persistence to graduation will resume, and that increases in college-going rates will offset underlying demographic forces and keep overall college enrollment from declining. Our analysis suggests that some types of colleges will fare better than others.
The key drivers of college enrollment trends are the number of young adults, their college-going rates, and their persistence in college. Changes in the number of young adults have outsized impacts on college enrollment. The overwhelming majority of college students are young adults (see Technical Appendix). And over the past 15 years almost all of the growth has occurred among young adults (18 to 24 years of age), who are at the traditional ages for college enrollment. California is projected to have little to no growth in key college-going age groups between now and 2035, and then some notable declines (Figure 7).
Figure 7
Population projections suggest little or no growth in key age groups
Population of key age groups

SOURCE: PPIC based on ACS estimates from 2006 to 2021 and DOF projected growth rates from 2021 to 2040.
Of particular importance are the number of high school graduates, including those who have completed the A–G requirement. Department of Finance projections suggest that the number of high school graduates will decline sharply between now and 2035. Using the same grade progression ratio model as the DOF, our extended projections show continued decline to 2040, although it is much more encouraging when we focus on A–G graduates. Our projections suggest that the number of A–G graduates will remain fairly level through the projection period.
Our Projections Suggest Enrollment Increases up to 2035
Our projections suggest that overall college enrollment in California will increase slightly to 2035 and then begin to decline. This period of slow growth comes after decades of strong increases. As noted previously, these increases were driven by both population gains—especially among young adults and recent high school graduates—and also by increases in college-going rates among young adults. Age-specific participation rates peaked in 2019, and then declined with the pandemic. Despite popular rhetoric about growth in enrollment among older Californians pursuing upskilling, we see very low rates of participation at older ages and no sign of a significant increase in college participation among Californians over the age of 30. Our projections are highly dependent on increasing participation among young adults.
We project improvement in one key area: diversity at California’s colleges will increase. In particular, we project that continued improvements in completion of the A–G coursework will lead to notable increases in the share of Latino students at UC and CSU. In contrast, the share of Black students will not change much, despite increases in college participation rates. Declining populations of young Black adults will counteract increases in participation rates. The share of white students will vary by institution, and Asian students will continue to have the highest college participation rates.
These overall enrollment projections mask variation across higher education segments. Our own projections mirror trends over the past 15 years. Each segment (UC, CSU, CCC, and private nonprofit colleges) has seen improvements in persistence, but enrollment trends are diverging.
UC Will See Moderate Enrollment Growth
As we have seen, UC has had the strongest rate of enrollment gains over the past 15 years. With continued increases in A–G completion rates, we project that demand will remain strong for UC. Moreover, the system’s nine undergraduate campuses draw students from outside their local regions and are therefore less vulnerable to local population changes.
Our projections indicate that UC will continue to see robust undergraduate enrollment growth (Figure 8). Even so, this growth will be substantially lower than growth experienced over the past 15 years. One of the underlying assumptions of the projection model is that as more students meet UC’s eligibility criteria, the university will find space to accommodate them.(6) (And that, of course, will depend on state funding support.) In the later years of the forecast, steep declines in high school graduates and declines in community college enrollment will limit the supply of potential new students, and enrollment is projected to decline.
Asian and Pacific Islander (API) students will remain the largest racial/ethnic group at UC, according to our projections. Asian students have the highest A–G completion rates and are projected to have the highest population growth rates by the Department of Finance. The share of Asian American UC undergraduates is projected to grow from 31 percent in fall 2022 to 35 percent by fall 2040.
Latino students have made strong gains in A–G completion and UC enrollment; the share of Latino UC undergraduates is projected to grow from 27 percent to 30 percent. White students and Black students are projected to remain at 21 percent and 2 percent, respectively.
Figure 8
Undergraduate enrollment and diversity at UC will continue to increase
SOURCES: UCOP to 2022 and PPIC projections 2023 to 2040.
NOTES: Fall enrollment. See Technical Appendix for details.
CSU Will Experience Solid Growth
We project that CSU will see solid enrollment growth to 2035 (Figure 9). By 2030, enrollment should surpass its 2020 peak. Increased demand among first-time freshmen who have recently completed high school as well as increases in transfer students from community colleges will be enough to overcome anemic population growth and declines in the number of high school graduates. As with UC (and for the same reasons), the system will experience slight declines in enrollment from 2035 to 2040, with a small boost from improvements in persistence and graduation rates.
CSU will continue to reflect the full diversity of California’s high school graduates. Latino students will continue to grow as a share of undergraduates, making up a majority (52%) by 2040. This continued growth reflects longstanding patterns. Latino students became the single largest racial/ethnic group at CSU in 2012 (33%), and the share of Latinos grew to 47 percent by 2022. Asian and Pacific Islander students will see modest gains; the share of API students will increase from 17 percent in 2022 to 19 percent in 2040; white students will decline from 22 percent to 17 percent and Black students will decline from 4 percent to 3 percent.
Figure 9
Undergraduate enrollment at CSU will grow slowly
SOURCES: CSU to 2022 and PPIC projections 2023 to 2040.
NOTES: Fall enrollment. See Technical Appendix for details.
Enrollment at the CCC Will Not Recover to Pre-Pandemic Levels
After recent declines, our projections indicate that community college enrollment will experience some growth but not recover to earlier levels. The community colleges disproportionately draw high school graduates who have not met UC and CSU eligibility criteria, a group that will shrink over the next 15 years. Between 2021–22 and 2039–40, we project that the number of high school graduates who do not complete A–G coursework will decrease from 210,000 to 127,000 (a 40% decline).
Improved persistence will help keep community college enrollment from falling further. Because the vast majority of community college students do not transfer or complete their community college programs, the upside potential for enrollment gains via increases in persistence are large. The system has identified the potential to increase enrollment among 25- to 54-year-olds, noting that efforts to increase access for this group could “generate over 300,000 new students across the system.” Our projections anticipate some increases for those age groups, but nowhere near as many as the system’s “Vision 2030” goal.
The state’s community colleges reflect the diversity of the state’s high school graduates and young adult population. Latinos are the largest group and will remain so (Figure 10). Among the three public systems, the racial/ethnic makeup of community college students is projected to change the least over the next 18 years.
California’s Private Nonprofit Colleges Will See Modest Growth in the Next Decade
The state’s 99 private nonprofit colleges range dramatically in selectivity and size—from fewer than 1,000 students to more than 20,000 undergraduates (Figure 11).(7) Most of the less-selective colleges have seen no enrollment growth or outright declines over the past ten years. According to our projections, private nonprofit colleges will see modest growth to 2035, after which enrollment will decline. By 2040, enrollment will be about the same as prior to the pandemic.
Many private nonprofit colleges enroll students from across the nation (and beyond), so it might not be surprising that this higher education segment does not fully reflect California’s diverse population. Even so, a majority of students at private nonprofit colleges are from California, and notable changes are projected to occur in terms of race/ethnic distributions. Specifically, white students are projected to remain the largest racial/ethnic group but will make up only a third of the undergraduate population (33%) in 2040, down from nearly half (47%) in 2010 (the earliest year of available data). The share of Latino students will increase to 28 percent of undergraduates, and the share of Asian students will rise to 21 percent. The share of white and Black students will decrease very slightly.
Figure 11
Private nonprofit enrollment will increase slightly
SOURCES: IPEDS to 2021 and PPIC projections 2022 to 2040.
NOTES: Restricted to Title IV degree-granting colleges. Excludes University of the People. See Technical Appendix for details.
California’s Public Systems Plan to Increase Enrollment—but Face Capacity and Funding Constraints
Meeting the state’s goal of reaching 70 percent postsecondary attainment among California adults by 2030 will require systematic planned increases in both demand and supply. In 2022, the Newsom administration forged multi-year compacts with UC and CSU through 2026–27 to increase the number of California resident undergraduates and graduates, including an agreement to provide funding for consistent enrollment gains. UC and CSU have developed their own plans for longer-term growth, which provide insights into how the state’s public institutions view the future of demand and how they envision meeting it. The CCC agreed to a roadmap with the state that did not contain specific funding commitments for enrollment increases, but the system has received additional funding tied to enrollment growth and continues to play a crucial role in supporting growth at UC and CSU through transfers. In this section, we highlight where the systems stand with their enrollment targets and discuss their longer-term plans for growth.
It should be noted that the projections presented earlier in the report are of headcount enrollments, which are based on estimates of the total number of individual students. Our projections are in line with the approach taken by the Department of Finance and reflect the potential number of students who could earn a degree. In this section, however, we present full-time equivalent (FTE) measures, which consider student’s credit-taking behavior. This metric is used by the state legislature for budgeting purposes and by each system to estimate capacity, as it better reflects the operating and capital costs required to serve students.(8)
The Statewide Compacts Are in Flux
Generally speaking, the state sets enrollment expectations for UC and CSU in its annual budget, providing a General Fund augmentation based on the number of additional students each system is to enroll. The 2022 budget, enacted in a year of surplus, provided funding for increased enrollment at both systems, while the multi-year compacts laid out plans to increase base resources by 5 percent annually to support 1 percent enrollment gains each year through 2026–27.
With the state projected to face modest operating deficits over the next few years, the status of future funding is uncertain (LAO 2024a). The governor’s 2024–25 revised budget plan proposes to delay base increases for UC and CSU until next year and cut funding for other programs. Amid uncertainty about UC and CSU recovering from pandemic-induced enrollment declines and hitting their agreed-upon enrollment targets, recent budgets have provided adjusted yearly enrollment goals for each system, with the focus on reaching a cumulative target by 2026–27 (Table 1).
Figure 12
Plans to meet FTE enrollment goals in UC and CSU compacts

The UC 2023 Compact Report projects overall enrollment growth of over 16,000 FTE resident students, with more than a 3 percent increase in 2023–24 and more than 1 percent growth in each of the following years (UC 2023). The CSU 2023 Compact Report sets a more ambitious goal, to make up for a decline in FTE enrollment in 2022–23 (CSU 2023). CSU hopes to expand access at its most in-demand campuses by shifting new enrollment resources from campuses experiencing sustained enrollment declines. Adaptation and effective support will be crucial to widening access in the short term and meeting increased demand among A–G students in the long term.
Since 2021–22, the state budget has included about $30 million for 0.5 percent systemwide enrollment growth at CCC (equivalent to about 5,500 additional FTE students), per Proposition 98. Additionally, each budget included one-time funds to support community college efforts to increase retention rates and enrollment. Community college FTE enrollment seems to have increased in 2022–23 for the first time since the pandemic, but it remains far below pre-pandemic levels. The LAO estimated that at the time of the proposed 2024–25 budget, about a third of student outreach funding from the 2022–23 budget one-time allocation remained available (LAO 2024b). Colleges also have until 2026–27 to spend COVID-19 block grant funds, which can be used to increase enrollment and retention.
The State’s Public Institutions Have Longer-Term Enrollment and Capacity Plans—and Constraints
In addition to developing short-term plans to meet enrollment targets set by their compacts with the governor, UC, CSU, and CCC have also developed longer-term plans that project future enrollment and evaluate capacity needs.
UC’s long-term plans and challenges
The UC 2030 Capacity Plan outlines two enrollment scenarios from 2020–21 to 2029–30: a plan to add more than 23,000 state-supported undergraduate FTE students, in line with the original multi-year compact; and an aspirational plan to grow by over 33,000 state-supported undergraduate FTE students, which would require additional funding (UC Council of Chancellors Capacity Working Group 2022a). In its Building 2030 Capacity report, UC outlines enrollment goals and capacity needs for each campus (UC Council of Chancellors Capacity Working Group 2022b). Each UC campus also has its own Long Range Development Plan (LRDP); each LRDP includes population projections and estimates of growth potential over a specific planning horizon to inform comprehensive land use plans.(9) Implementing LRDPs can be challenging. Part of the LRDP approval process includes preparing an Environmental Impact Report (EIR) in compliance with the California Environmental Quality Act (CEQA).
In addition, lawsuits and neighborhood opposition can delay expansion and construction, incur mitigation costs, and result in less-efficient growth. Relatedly, insufficient housing capacity continues to be a major challenge; several campuses have stressed the need to align enrollment growth with additional bed spaces. At UC Berkeley, for example, the campus LRDP projects growth of 8,100 students through 2036, but capacity constraints, stringent local sustainability goals, and neighborhood opposition may limit increases in enrollment.
Future enrollment growth may have to be accommodated outside of the system’s largest and most in-demand campuses. Promisingly, UC Merced and UC Riverside account for 30 percent and 35 percent of the UC system’s projected growth, respectively; this signals an emphasis on increasing enrollment among campuses in the San Joaquin Valley and Inland Empire, regions that have been historically underrepresented in the UC system. While these campuses face fewer challenges in expanding capacity, enrollment among admitted students at both campuses is relatively low compared to the rest of the system.
CSU enrollment demand and capacity constraints
The 2019 budget tasked the CSU Office of the Chancellor, in consultation with the California Department of Finance, to assess future growth, including statewide demand and physical capacity. In 2020, an independent consulting team conducted this analysis, producing a study titled The California State University: Enrollment Demand, Capacity Assessment, and Cost Analysis for Campus Sites, which presents a projection of undergraduate enrollment demand among first-time freshmen and transfer students through 2035 (HOK et al. 2020a, HOK et al. 2020b).(10)
Importantly, the study relies on data collected and analyzed from November 2019 through March 2020. As a result, it does not factor in the large declines in enrollment and persistence brought on by the pandemic, which led to significant declines in transfers from community colleges. The report also leaves out other recent trends that are likely to affect future enrollment, such as changes in A–G completion rates after 2016, regional initiatives aimed at improving K–12 outcomes, adjustments to CSU admission requirements (e.g., the abolition of standardized testing requirements), the expansion of online learning, and efforts to widen transfer pathways and reduce barriers to transfer, and migration patterns to and from California.
Despite these limitations, we can glean useful insights from CSU’s projections of future demand in the context of expected growth in eligibility and regional demographic trends. The report projects a moderate increase in CSU enrollment through 2035, with a systemwide increase of approximately 43,800 FTE students, more than a quarter coming from the Central Valley. The report also finds that at the time of publication, systemwide CSU enrollment already exceeded its legislatively defined physical capacity, highlighting an immediate need to increase capacity.(11) The authors estimated that the system would need to increase its capacity by more than 35 percent to meet 2035 projected enrollment demand (Table 2). Promisingly, aggregate plans to increase capacity across campuses were sufficient to meet this demand, assuming campuses could effectively and efficiently update and construct all planned facilities.
Figure 13
Projected 2035 CSU enrollment and current/planned capacity

CCC’s uncertain future
As part of its projection of future transfers from the community colleges to CSU, the Enrollment Demand, Capacity Assessment, and Cost Analysis for Campus Sites study provides a pre-pandemic perspective on the future of community college enrollment (HOK et al. 2020a, HOK et al. 2020b).(12) The study projects that community college enrollment among students taking 12 or more units per semester—a key indicator of the likelihood of transfer—would drop slightly from 2017 to 2035, with growth in the Central Valley and Inland Empire and declines in the Bay Area and Los Angeles. Alternatively, in its five-year capital outlay plan released in February 2024, the California Community College Chancellor’s Office projected 1.7 percent enrollment growth, an increase of over 24,000 students, from 2024–25 to 2028–29 (CCCCO 2024).(13) While these differing projections reflect uncertainty about community college enrollment, increases over the past year suggest that growth may be possible. What does seem certain is CCC’s need for additional funding for capital facilities to accommodate any enrollment growth.
UC, CSU, and CCC Face Capital Facilities Funding Challenges
Historically, UC and CSU received capital facilities funding via voter-approved General Obligation (GO) bonds or lease-revenue bonds. However, no GO bonds have been approved since 2006. Funding streams have shifted since the systems were granted expanded debt-financing authority; funding now comprises a complex blend of debt instruments and revenue sources, including state bonds and loans, investment income, private investment, student fees, and philanthropy. It must be noted that CSU campuses have significantly less access to these sources than UC.
Local CCC districts—which have long made most of their own capital finance decisions and have the authority to tax and borrow—have been able to cover their capital needs.(14) Still, all three systems have consistently stressed the need for capital facilities funding to support future enrollment growth. This need has not been sufficiently addressed in recent budget and compact targets, and state funding will likely be more difficult to secure given an uncertain budget future (UC 2023b, CSU 2023b, CCCCO 2024).
There is no state plan to address identified capital renewal needs, and the systems are facing growing maintenance backlogs (LAO 2023). Furthermore, the systems have all identified unmet funding needs for the construction of new facilities to accommodate growing student populations. SB 28, a bill that would have placed a $15.5 billion GO bond to fund K–16 facility construction on the March 2024 ballot was ultimately shelved. Future support for expanding student housing, in particular, remains uncertain. While the governor’s proposed budget for 2024–25 includes funding for the Higher Education Student Housing Grant (HESHG) program, which supports additional housing projects and helps maintain affordability among existing units, it also suspends significant investment in the California Student Housing Revolving Loan Fund Program, which provides zero-interest loans for below-market-rate student housing projects.
In short, the state’s higher education systems are likely to continue to face significant shortfalls in much-needed capital facilities funding. Long-term development plans from the UC, CSU, and CCC suggest enrollment growth is a priority, but accommodating this growth requires sufficient capacity, which in turn requires funding.
UC and CSU Have Developed Growth Strategies in the Context of Capacity Constraints
As we have seen, UC and CSU have struggled to meet the short-term goals laid out in their multi-year compacts, and they may face longer-term headwinds due to changes in the state’s demographics. And even if demand rises due to increases in A–G completion, the systems may face persistent supply and capacity constraints. Promisingly, UC and CSU have strategized several ways and implemented various initiatives to promote enrollment growth, addressing demand-side challenges by expanding opportunities for students to access their institutions, and addressing supply-side challenges by using current capacity more efficiently.
Both UC and CSU have prioritized expanding intersegmental collaboration. In its 2022 Budget Compact Report, CSU cited multiple efforts to boost enrollment, including a new partnership with the Los Angeles Unified School District, as well as planned collaboration with CCCs to expand dual enrollment opportunities (CSU 2022). UC’s 2030 Capacity Plan explicitly highlights the system’s goal of increasing enrollment at campuses in the San Joaquin Valley and Inland Empire through various intersegmental and outreach efforts, including collaboration with the community college and K–16 systems to streamline freshmen and transfer pathways.
Both systems have explored ways to increase transfers from community colleges, piloting dual admissions programs that guarantee admission for community college students who were not initially admitted as freshmen applicants, and expanding pathways through their respective Associate Degree for Transfer (ADT) program, Transfer Admission Guarantee (TAG), University of California Transfer Pathways (UCTP), and Pathways+.
Removing barriers to access is also a priority. Many programs and campuses at UC and CSU are impacted, meaning they receive more eligible applicants than can be accommodated. This, in turn, results in stricter admissions criteria that makes it more difficult for otherwise-eligible students to be admitted. Some CSU campuses have recently discontinued impaction, removing stricter admissions criteria for many of their programs in an attempt to address low yield rates among redirected admits and increase enrollment among qualified applicants.
At the same time, UC and CSU have embraced non-traditional growth strategies to increase enrollment in the context of current capacity constraints. Reducing the time it takes students to earn degrees not only helps campuses achieve their multi-year compact goals to increase graduation rates but also allows more new students to enroll. To reduce the time to degree, CSU and UC are providing more effective and tailored academic supports, offering expanded advising, improving their curricula, and scaling policies and practices that worked well during the pandemic.
The systems have also explored increasing online, summer, and off-campus offerings—including study abroad programs, off-campus internships, and partnerships with other institutions. Together, these efforts allow campuses to take in more students without having to expand their physical capacity.
Implications for the Future
The population of young adults most likely to attend college is expected to grow very slowly—or not at all—over the next couple of decades. But our projections show that if college-going rates—as well as persistence and graduation rates—continue to rise, college enrollment will increase slightly at least until 2035. Moreover, strong increases in college-going and completion among Latino students could help reduce educational attainment gaps among racial/ethnic groups.
A critical question is what this means for college completion. As we have seen, California has experienced sharp gains in the share of working-age adults with at least a bachelor’s degree, and it seems likely that continued increases in college participation will help California reach its baccalaureate completion goal of 40 percent by 2030. Compared to levels in many other states, however, this is a modest goal. It might be better to focus on increasing college completion among young adults to a higher level.
One approach would be to focus on the pathway from grade 9 to high school completion and then onto college completion. Currently, only about 35 percent of California ninth-graders will earn a bachelor’s degree by the time they are in their mid- to late 20s. Setting a goal of 45 percent would be both more ambitious and complementary to the current goal. By setting such a goal, California policymakers and higher education officials could concentrate their efforts at the precise ages where there is the most leverage: when high school students and young adults are making critical decisions about their educational pathways.
Our enrollment projections would translate to approximately 40 percent of young adults in California earning a bachelor’s degree by 2030 and almost 45 percent by 2040. We assume that there will be sufficient state support for students and the state’s colleges, and likely a relaxing of the outdated Master Plan guidelines for UC and CSU.
The capacity and enrollment plans of the state’s public universities are consistent with continued increases in college completion. Funding for increased capacity is often a challenge, but California’s long history of public investment in higher education is an impressive one. Bonds to pay for infrastructure, whether it is online capacity or brick and mortar classrooms, will need to be issued at some point. State support for annual operating expenses varies tremendously with state revenues, and multi-year compacts (or agreements) between the state and UC and CSU do not always weather these ups and downs. A long-term, flexible approach, involving a combination of tuition increases combined with increased financial aid, could help make higher education finance more predictable and sustainable.
Finally, increases in the number of high school graduates completing A–G coursework are critical to our projections. The statewide track record over the past couple of decades is impressive, but the pandemic has led to some disturbing trends, especially with respect to absenteeism. It is beyond the scope of this report to consider all the ways in which high schools can improve college readiness. But it is worth noting that there is wide variation in A–G completion across the state’s K–12 and high school districts, even among those with similar socioeconomic and demographic profiles. Clearly, local policies and practices—such as making A–G the default curriculum and creating a college-going culture—can and do make a difference.
It is important to underline that our projections of enrollment growth assume that the state’s university systems will be able to grow to accommodate student demand. This might require state investments in several areas, including capital and operating expenditures and financial aid for low- and middle-income students. Our underlying assumption is that if the state can increase the number of Californians who enroll in and graduate from college, California will continue to be a place of opportunity.
Topics
Access Completion Equity Finance Higher Education


Comments
Post a Comment